| Red | Green | Blue | |
| z | 17.64 | ||
| znorm | Inf | ||
| sky | -Inf | -Inf | -Inf |
| S/N | 15.2 | 26.3 | 29.9 |
| S/N(c) | 0.0 | 0.0 | 0.0 |
| SN(E/C) |

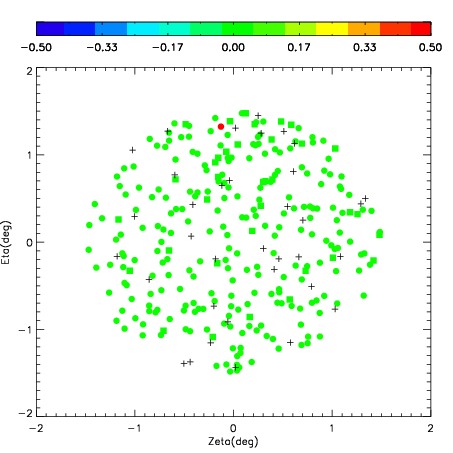
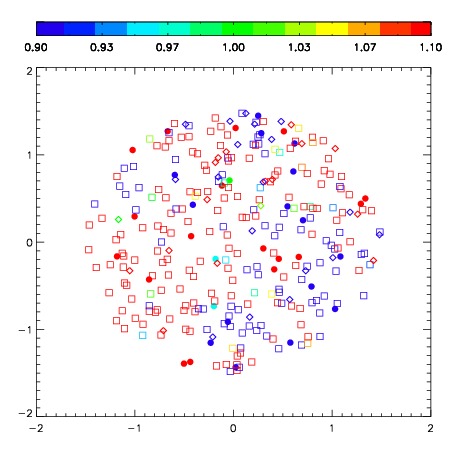


| Frame | Nreads | Zeropoints | Mag plots | Spatial mag deviation | Spatial sky 16325A emission deviations (filled: sky, open: star) | Spatial sky continuum emission | Spatial sky telluric CO2 absorption deviations (filled: H < 10) | |||||||||||||||||||||||
| 0 | 0 |
|
|
|
|
|
|
| IPAIR | NAME | SHIFT | NEWSHIFT | S/N | NAME | SHIFT | NEWSHIFT | S/N |
| 0 | 06420080 | 0.479193 | 0.00000 | 234.499 | 06420081 | 0.0447043 | 0.434489 | 257.709 |
| 1 | 06420079 | 0.475416 | 0.00377700 | 225.554 | 06420074 | 0.00000 | 0.479193 | 218.367 |
| 2 | 06420076 | 0.478533 | 0.000660002 | 211.958 | 06420077 | 0.0424253 | 0.436768 | 209.269 |
| 3 | 06420075 | 0.473502 | 0.00569099 | 211.856 | 06420078 | 0.0427729 | 0.436420 | 207.947 |