| Red | Green | Blue | |
| z | 17.64 | ||
| znorm | Inf | ||
| sky | -Inf | -Inf | -Inf |
| S/N | 27.7 | 46.8 | 52.0 |
| S/N(c) | 0.0 | 0.0 | 0.0 |
| SN(E/C) |

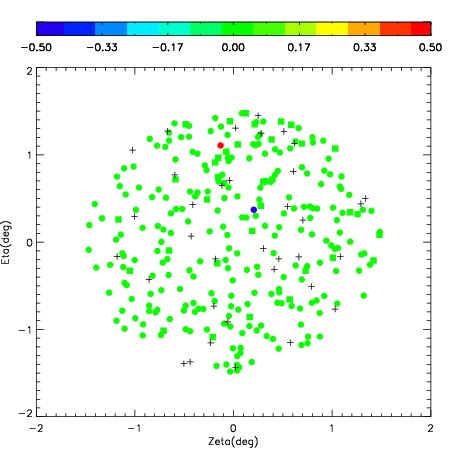
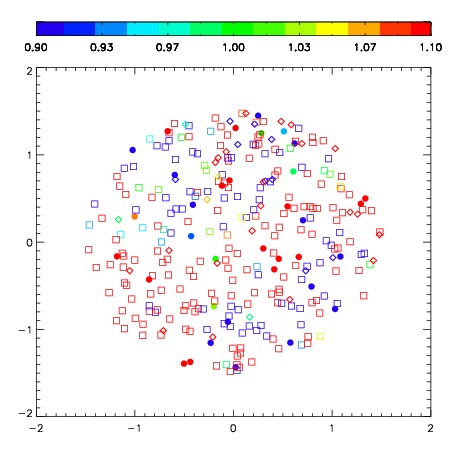

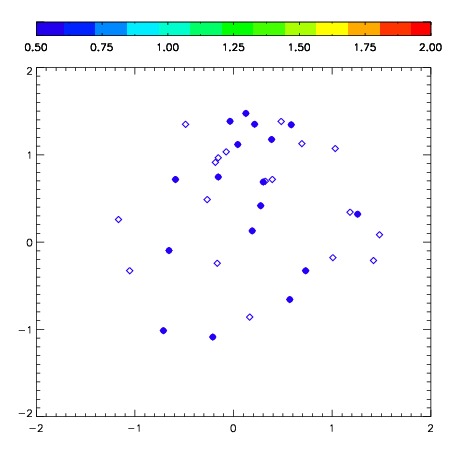
| Frame | Nreads | Zeropoints | Mag plots | Spatial mag deviation | Spatial sky 16325A emission deviations (filled: sky, open: star) | Spatial sky continuum emission | Spatial sky telluric CO2 absorption deviations (filled: H < 10) | |||||||||||||||||||||||
| 0 | 0 |
|
|
|
|
|
|
| IPAIR | NAME | SHIFT | NEWSHIFT | S/N | NAME | SHIFT | NEWSHIFT | S/N |
| 0 | 06650086 | 0.460016 | 0.00000 | 301.117 | 06650085 | 0.0328186 | 0.427197 | 0.0813584 |
| 1 | 06650082 | 0.453206 | 0.00681001 | 310.975 | 06650081 | 0.00000 | 0.460016 | 316.093 |
| 2 | 06650083 | 0.455908 | 0.00410801 | 302.246 | 06650088 | 0.0266989 | 0.433317 | 301.285 |
| 3 | 06650087 | 0.456830 | 0.00318602 | 301.826 | 06650084 | 0.0296276 | 0.430388 | 295.852 |