| Red | Green | Blue | |
| z | 17.64 | ||
| znorm | Inf | ||
| sky | -Inf | -Inf | -Inf |
| S/N | 24.9 | 43.7 | 45.2 |
| S/N(c) | 0.0 | 0.0 | 0.0 |
| SN(E/C) |

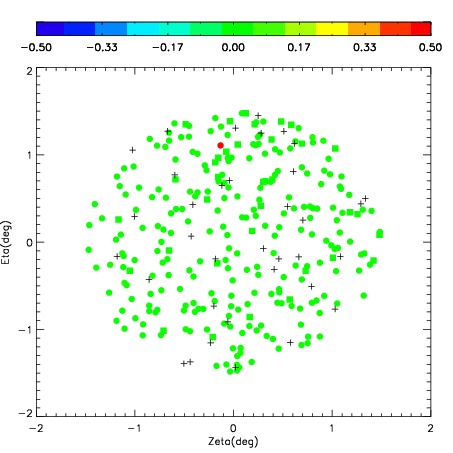
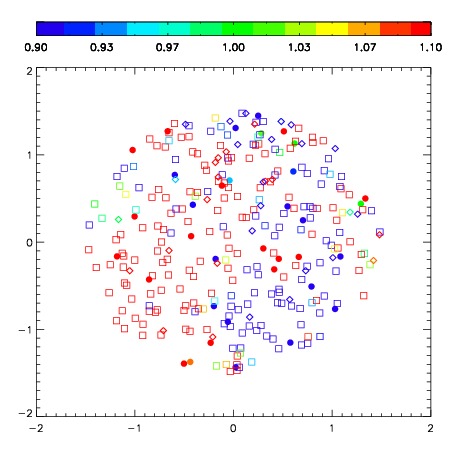
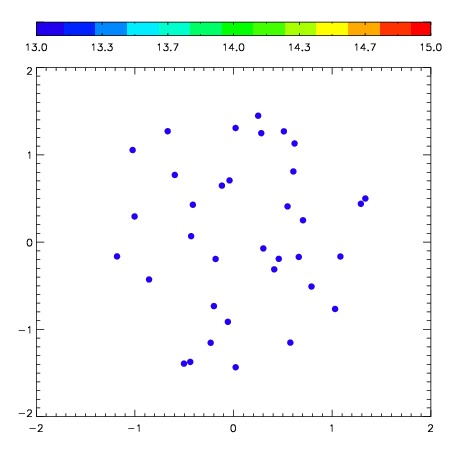
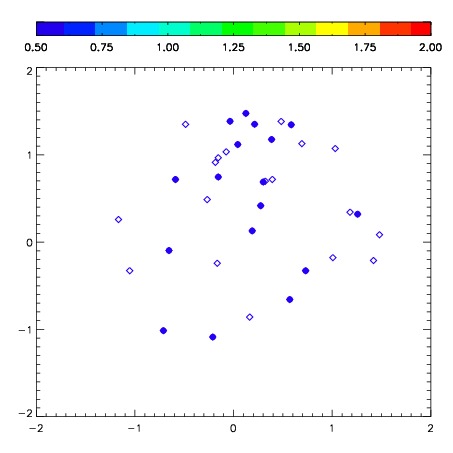
| Frame | Nreads | Zeropoints | Mag plots | Spatial mag deviation | Spatial sky 16325A emission deviations (filled: sky, open: star) | Spatial sky continuum emission | Spatial sky telluric CO2 absorption deviations (filled: H < 10) | |||||||||||||||||||||||
| 0 | 0 |
|
|
|
|
|
|
| IPAIR | NAME | SHIFT | NEWSHIFT | S/N | NAME | SHIFT | NEWSHIFT | S/N |
| 0 | 06690067 | 0.429986 | 0.00000 | 314.594 | 06690066 | 0.0459634 | 0.384023 | 308.166 |
| 1 | 06690063 | 0.414645 | 0.0153410 | 325.435 | 06690069 | 0.0418136 | 0.388172 | 320.191 |
| 2 | 06690068 | 0.426228 | 0.00375801 | 321.214 | 06690062 | 0.00000 | 0.429986 | 313.456 |
| 3 | 06690064 | 0.413563 | 0.0164230 | 319.641 | 06690065 | 0.0431444 | 0.386842 | 311.577 |