| Red | Green | Blue | |
| z | 17.64 | ||
| znorm | Inf | ||
| sky | -Inf | -Inf | -Inf |
| S/N | 23.7 | 41.2 | 44.3 |
| S/N(c) | 0.0 | 0.0 | 0.0 |
| SN(E/C) |
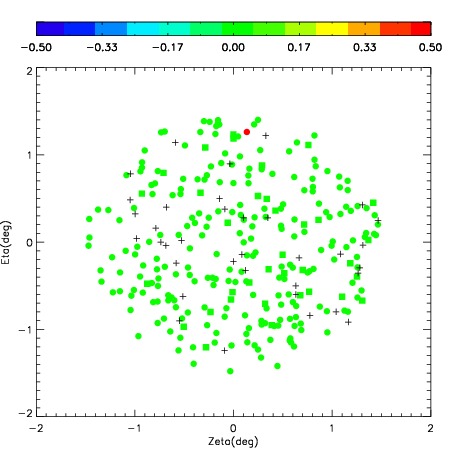

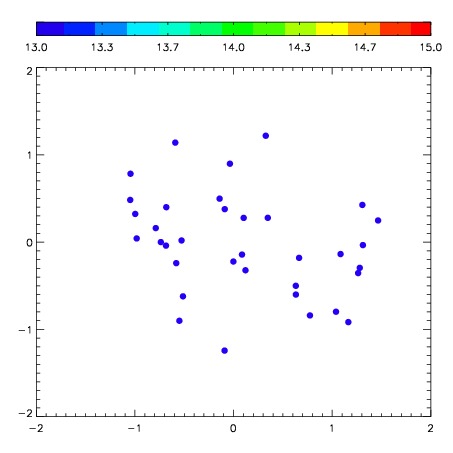

| Frame | Nreads | Zeropoints | Mag plots | Spatial mag deviation | Spatial sky 16325A emission deviations (filled: sky, open: star) | Spatial sky continuum emission | Spatial sky telluric CO2 absorption deviations (filled: H < 10) | |||||||||||||||||||||||
| 0 | 0 |
|
|
|
|
|
|
| IPAIR | NAME | SHIFT | NEWSHIFT | S/N | NAME | SHIFT | NEWSHIFT | S/N |
| 0 | 06740037 | 0.449306 | 0.00000 | 263.271 | 06740036 | 0.00000 | 0.449306 | 256.405 |
| 1 | 06740038 | 0.442147 | 0.00715902 | 277.101 | 06740043 | 0.0170442 | 0.432262 | 281.996 |
| 2 | 06740042 | 0.447676 | 0.00163001 | 272.133 | 06740039 | 0.0278483 | 0.421458 | 258.993 |
| 3 | 06740041 | 0.449084 | 0.000221997 | 255.579 | 06740040 | 0.0239339 | 0.425372 | 244.643 |