| Red | Green | Blue | |
| z | 17.63 | ||
| znorm | Inf | ||
| sky | -NaN | -NaN | -NaN |
| S/N | 28.5 | 47.8 | 52.8 |
| S/N(c) | 0.0 | 0.0 | 0.0 |
| SN(E/C) |
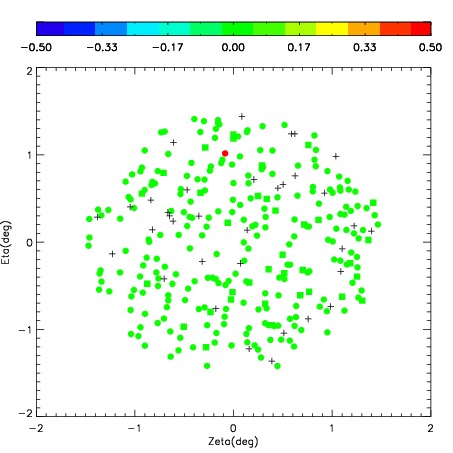

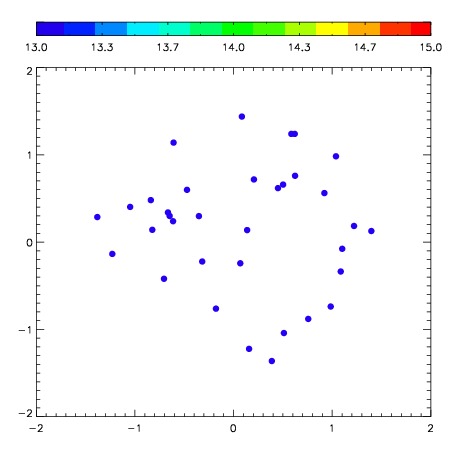
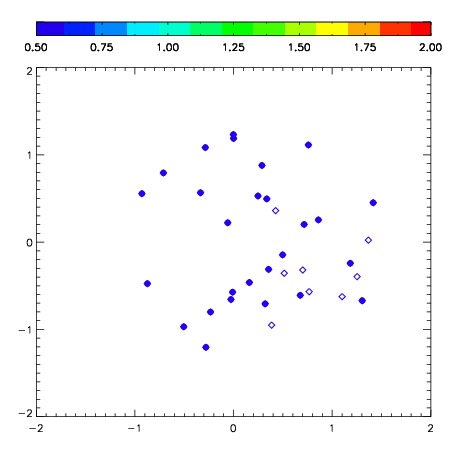
| Frame | Nreads | Zeropoints | Mag plots | Spatial mag deviation | Spatial sky 16325A emission deviations (filled: sky, open: star) | Spatial sky continuum emission | Spatial sky telluric CO2 absorption deviations (filled: H < 10) | |||||||||||||||||||||||
| 0 | 0 |
|
|
|
|
|
|
| IPAIR | NAME | SHIFT | NEWSHIFT | S/N | NAME | SHIFT | NEWSHIFT | S/N |
| 0 | 06930067 | 0.338990 | 0.00000 | 255.386 | 06930069 | -0.0255690 | 0.364559 | 251.343 |
| 1 | 06930064 | 0.330845 | 0.00814500 | 252.007 | 06930065 | -0.0223769 | 0.361367 | 251.040 |
| 2 | 06930068 | 0.326081 | 0.0129090 | 247.584 | 06930066 | -0.0190942 | 0.358084 | 247.760 |
| 3 | 06930063 | 0.331802 | 0.00718799 | 247.326 | 06930062 | 0.00000 | 0.338990 | 245.277 |