| Red | Green | Blue | |
| z | 17.64 | ||
| znorm | Inf | ||
| sky | -Inf | -Inf | -Inf |
| S/N | 18.3 | 34.7 | 38.8 |
| S/N(c) | 0.0 | 0.0 | 0.0 |
| SN(E/C) |

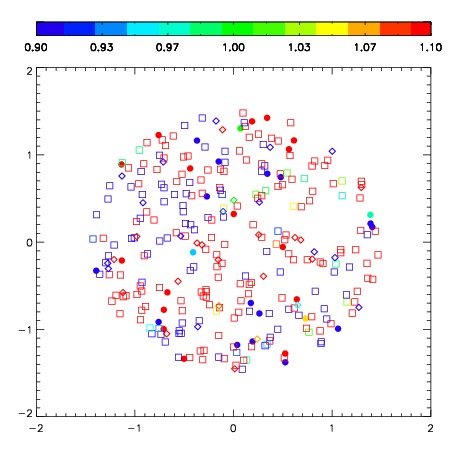


| Frame | Nreads | Zeropoints | Mag plots | Spatial mag deviation | Spatial sky 16325A emission deviations (filled: sky, open: star) | Spatial sky continuum emission | Spatial sky telluric CO2 absorption deviations (filled: H < 10) | |||||||||||||||||||||||
| 0 | 0 |
|
|
|
|
|
|
| IPAIR | NAME | SHIFT | NEWSHIFT | S/N | NAME | SHIFT | NEWSHIFT | S/N |
| 0 | 07040038 | 0.519526 | 0.00000 | 181.827 | 07040037 | 0.00000 | 0.519526 | 180.141 |
| 1 | 07040042 | 0.503343 | 0.0161830 | 223.557 | 07040041 | 0.0757412 | 0.443785 | 216.434 |
| 2 | 07040043 | 0.510429 | 0.00909698 | 204.560 | 07040044 | 0.0765760 | 0.442950 | 208.125 |
| 3 | 07040039 | 0.512837 | 0.00668901 | 192.177 | 07040040 | 0.0798508 | 0.439675 | 198.025 |