| Red | Green | Blue | |
| z | 17.64 | ||
| znorm | Inf | ||
| sky | -NaN | -Inf | -Inf |
| S/N | 29.4 | 49.6 | 56.7 |
| S/N(c) | 0.0 | 0.0 | 0.0 |
| SN(E/C) |


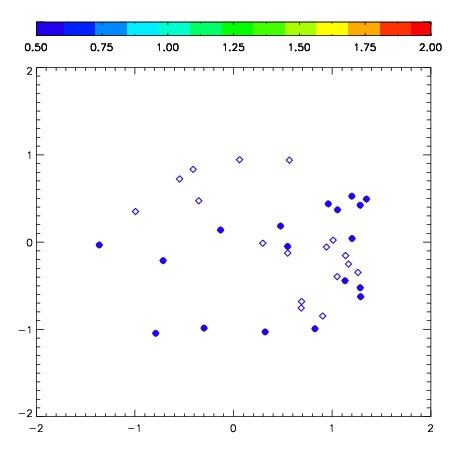
| Frame | Nreads | Zeropoints | Mag plots | Spatial mag deviation | Spatial sky 16325A emission deviations (filled: sky, open: star) | Spatial sky continuum emission | Spatial sky telluric CO2 absorption deviations (filled: H < 10) | |||||||||||||||||||||||
| 0 | 0 |
|
|
|
|
|
|
| IPAIR | NAME | SHIFT | NEWSHIFT | S/N | NAME | SHIFT | NEWSHIFT | S/N |
| 0 | 06730050 | 0.452060 | 0.00000 | 219.230 | 06730051 | 0.0145160 | 0.437544 | 221.737 |
| 1 | 06730054 | 0.448535 | 0.00352502 | 231.807 | 06730055 | 0.0168553 | 0.435205 | 230.579 |
| 2 | 06730053 | 0.444888 | 0.00717202 | 228.840 | 06730048 | 0.00000 | 0.452060 | 225.307 |
| 3 | 06730049 | 0.448455 | 0.00360501 | 221.222 | 06730052 | 0.0158633 | 0.436197 | 223.885 |