| Red | Green | Blue | |
| z | 17.64 | ||
| znorm | Inf | ||
| sky | -NaN | -Inf | -Inf |
| S/N | 21.0 | 36.0 | 41.7 |
| S/N(c) | 0.0 | 0.0 | 0.0 |
| SN(E/C) |

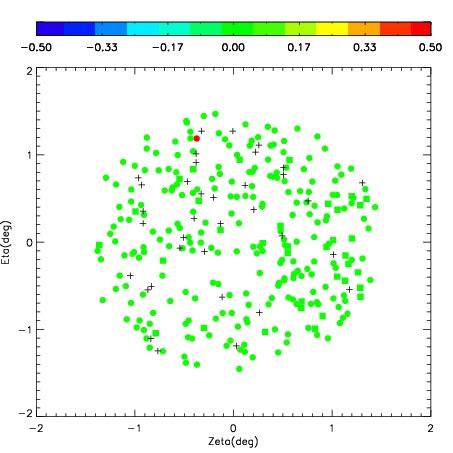
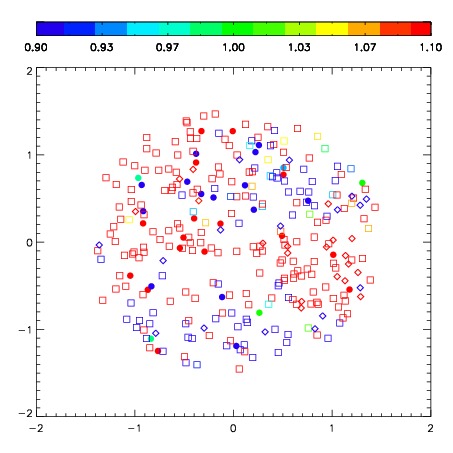

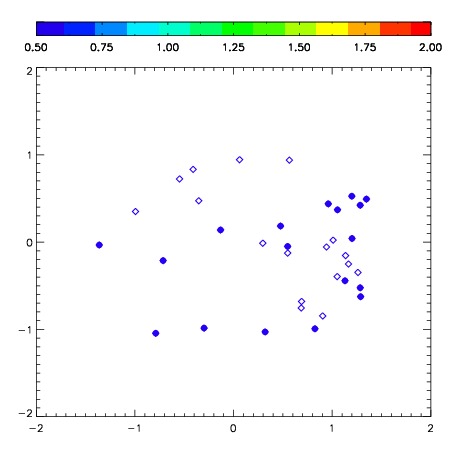
| Frame | Nreads | Zeropoints | Mag plots | Spatial mag deviation | Spatial sky 16325A emission deviations (filled: sky, open: star) | Spatial sky continuum emission | Spatial sky telluric CO2 absorption deviations (filled: H < 10) | |||||||||||||||||||||||
| 0 | 0 |
|
|
|
|
|
|
| IPAIR | NAME | SHIFT | NEWSHIFT | S/N | NAME | SHIFT | NEWSHIFT | S/N |
| 0 | 06770027 | 0.460069 | 0.00000 | 177.345 | 06770028 | 0.00160104 | 0.458468 | 199.442 |
| 1 | 06770031 | 0.446334 | 0.0137350 | 185.304 | 06770032 | 0.00489211 | 0.455177 | 206.517 |
| 2 | 06770026 | 0.451075 | 0.00899401 | 184.151 | 06770025 | 0.00000 | 0.460069 | 200.045 |
| 3 | 06770030 | 0.451265 | 0.00880399 | 165.324 | 06770029 | 0.00321247 | 0.456857 | 190.103 |