| Red | Green | Blue | |
| z | 17.64 | ||
| znorm | Inf | ||
| sky | -NaN | -Inf | -Inf |
| S/N | 25.6 | 43.0 | 49.4 |
| S/N(c) | 0.0 | 0.0 | 0.0 |
| SN(E/C) |

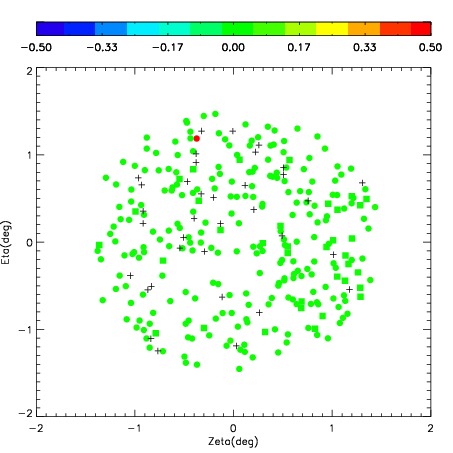

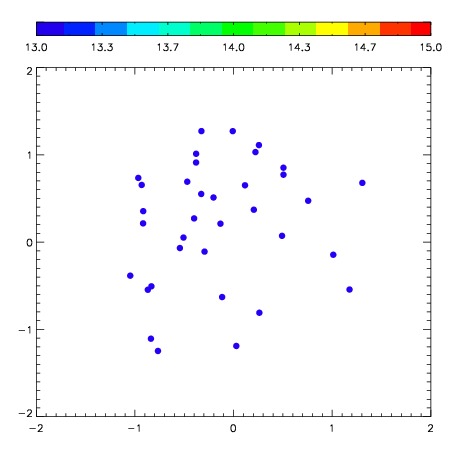
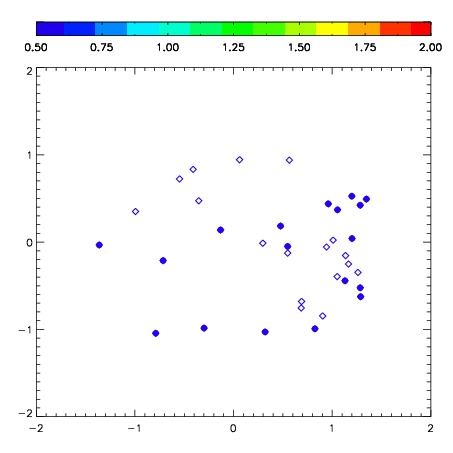
| Frame | Nreads | Zeropoints | Mag plots | Spatial mag deviation | Spatial sky 16325A emission deviations (filled: sky, open: star) | Spatial sky continuum emission | Spatial sky telluric CO2 absorption deviations (filled: H < 10) | |||||||||||||||||||||||
| 0 | 0 |
|
|
|
|
|
|
| IPAIR | NAME | SHIFT | NEWSHIFT | S/N | NAME | SHIFT | NEWSHIFT | S/N |
| 0 | 07000078 | 0.366523 | 0.00000 | 216.366 | 07000079 | -0.0374820 | 0.404005 | 216.169 |
| 1 | 07000074 | 0.358551 | 0.00797200 | 224.134 | 07000075 | -0.0421169 | 0.408640 | 221.728 |
| 2 | 07000077 | 0.364598 | 0.00192499 | 218.039 | 07000076 | -0.0394269 | 0.405950 | 218.386 |
| 3 | 07000073 | 0.355771 | 0.0107520 | 214.900 | 07000072 | 0.00000 | 0.366523 | 209.334 |