| Red | Green | Blue | |
| z | 17.64 | ||
| znorm | Inf | ||
| sky | -Inf | -Inf | -Inf |
| S/N | 34.4 | 53.7 | 64.6 |
| S/N(c) | 0.0 | 0.0 | 0.0 |
| SN(E/C) |


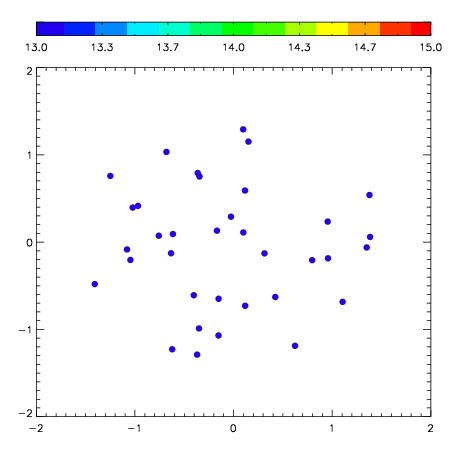
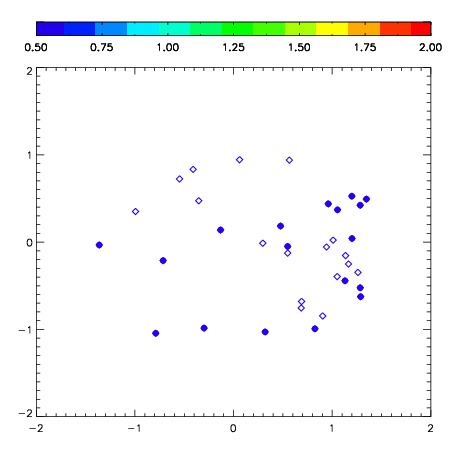
| Frame | Nreads | Zeropoints | Mag plots | Spatial mag deviation | Spatial sky 16325A emission deviations (filled: sky, open: star) | Spatial sky continuum emission | Spatial sky telluric CO2 absorption deviations (filled: H < 10) | |||||||||||||||||||||||
| 0 | 0 |
|
|
|
|
|
|
| IPAIR | NAME | SHIFT | NEWSHIFT | S/N | NAME | SHIFT | NEWSHIFT | S/N |
| 0 | 06970052 | 0.418047 | 0.00000 | 225.192 | 06970053 | -0.0158351 | 0.433882 | 223.556 |
| 1 | 06970048 | 0.413534 | 0.00451303 | 226.271 | 06970049 | -0.0152562 | 0.433303 | 224.016 |
| 2 | 06970051 | 0.415112 | 0.00293502 | 225.419 | 06970050 | -0.0205259 | 0.438573 | 223.928 |
| 3 | 06970055 | 0.401203 | 0.0168440 | 220.108 | 06970057 | -0.0247259 | 0.442773 | 222.659 |
| 4 | 06970056 | 0.396181 | 0.0218660 | 218.279 | 06970054 | -0.0158821 | 0.433929 | 219.797 |
| 5 | 06970047 | 0.415390 | 0.00265700 | 215.711 | 06970046 | 0.00000 | 0.418047 | 212.292 |