| Red | Green | Blue | |
| z | 17.64 | ||
| znorm | Inf | ||
| sky | -Inf | -NaN | -Inf |
| S/N | 26.0 | 45.0 | 48.3 |
| S/N(c) | 0.0 | 0.0 | 0.0 |
| SN(E/C) |

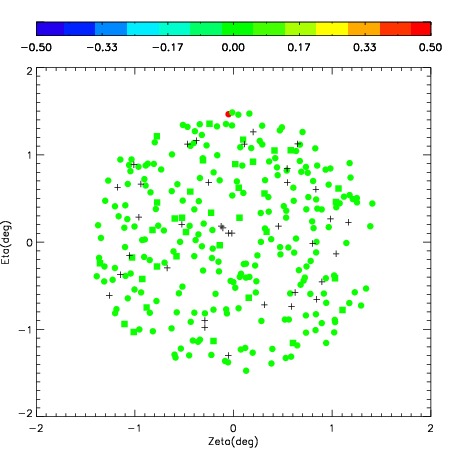
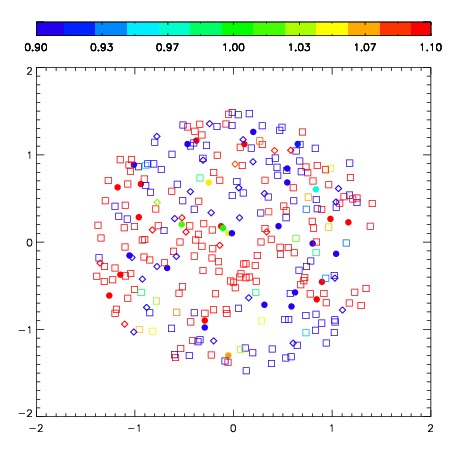
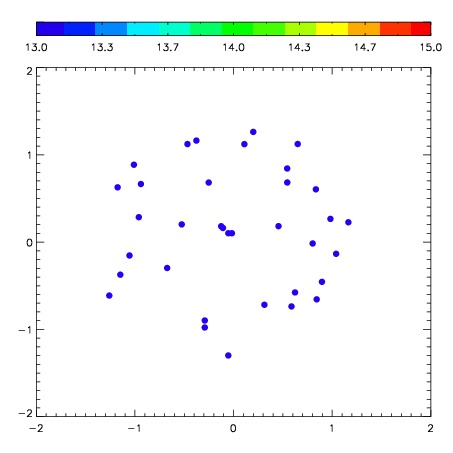

| Frame | Nreads | Zeropoints | Mag plots | Spatial mag deviation | Spatial sky 16325A emission deviations (filled: sky, open: star) | Spatial sky continuum emission | Spatial sky telluric CO2 absorption deviations (filled: H < 10) | |||||||||||||||||||||||
| 0 | 0 |
|
|
|
|
|
|
| IPAIR | NAME | SHIFT | NEWSHIFT | S/N | NAME | SHIFT | NEWSHIFT | S/N |
| 0 | 06680067 | 0.401081 | 0.00000 | 248.863 | 06680065 | 0.00000 | 0.401081 | 249.592 |
| 1 | 06680070 | 0.395151 | 0.00593001 | 260.367 | 06680072 | 0.0161276 | 0.384953 | 262.246 |
| 2 | 06680066 | 0.394307 | 0.00677401 | 253.528 | 06680069 | 0.0174211 | 0.383660 | 261.596 |
| 3 | 06680071 | 0.399739 | 0.00134200 | 252.117 | 06680068 | 0.0196934 | 0.381388 | 250.619 |