| Red | Green | Blue | |
| z | 17.64 | ||
| znorm | Inf | ||
| sky | -Inf | -Inf | -Inf |
| S/N | 33.2 | 55.3 | 61.5 |
| S/N(c) | 0.0 | 0.0 | 0.0 |
| SN(E/C) |

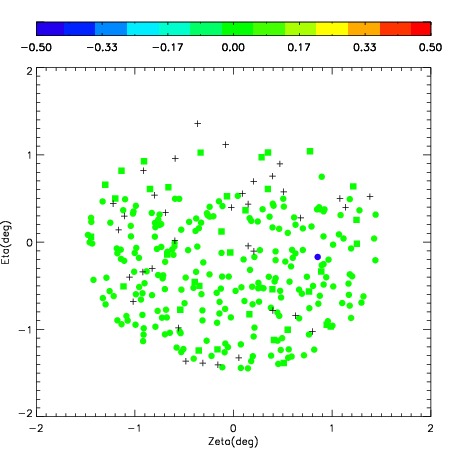
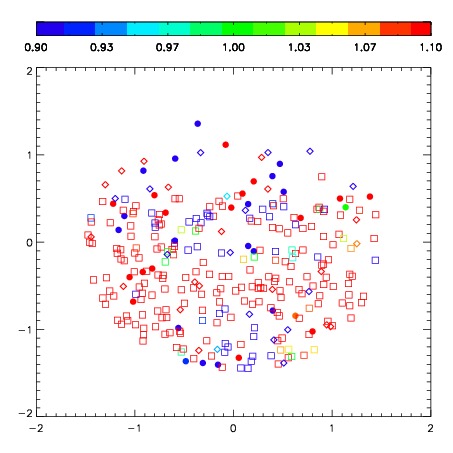

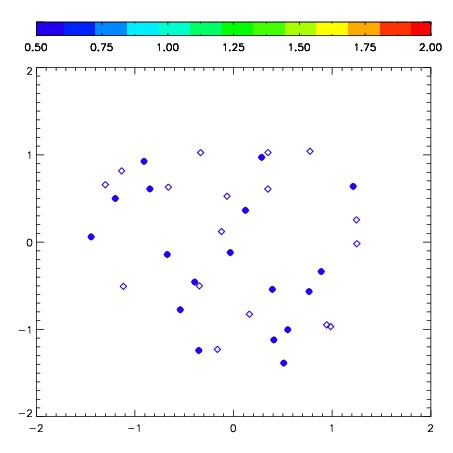
| Frame | Nreads | Zeropoints | Mag plots | Spatial mag deviation | Spatial sky 16325A emission deviations (filled: sky, open: star) | Spatial sky continuum emission | Spatial sky telluric CO2 absorption deviations (filled: H < 10) | |||||||||||||||||||||||
| 0 | 0 |
|
|
|
|
|
|
| IPAIR | NAME | SHIFT | NEWSHIFT | S/N | NAME | SHIFT | NEWSHIFT | S/N |
| 0 | 06970089 | 0.478997 | 0.00000 | 249.142 | 06970087 | 0.0143890 | 0.464608 | 249.030 |
| 1 | 06970085 | 0.477305 | 0.00169200 | 258.462 | 06970083 | 0.00000 | 0.478997 | 255.504 |
| 2 | 06970084 | 0.471927 | 0.00707000 | 257.990 | 06970086 | 0.0159040 | 0.463093 | 251.115 |
| 3 | 06970088 | 0.474467 | 0.00452998 | 249.186 | 06970090 | 0.0156082 | 0.463389 | 250.748 |
| 4 | 06970092 | 0.475944 | 0.00305298 | 243.036 | 06970091 | 0.0150130 | 0.463984 | 243.932 |