| Red | Green | Blue | |
| z | 17.64 | ||
| znorm | Inf | ||
| sky | -NaN | -Inf | -Inf |
| S/N | 17.2 | 32.2 | 36.4 |
| S/N(c) | 0.0 | 0.0 | 0.0 |
| SN(E/C) |

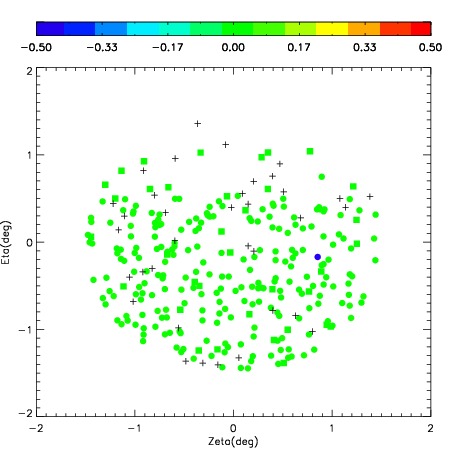

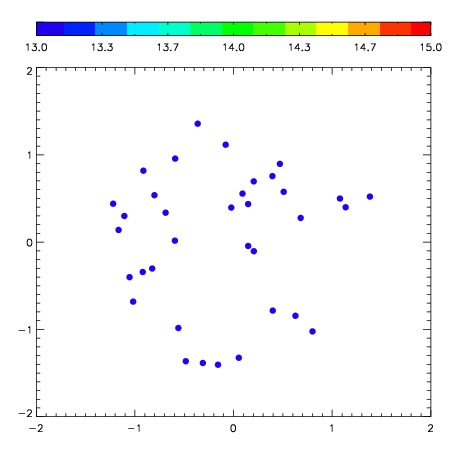
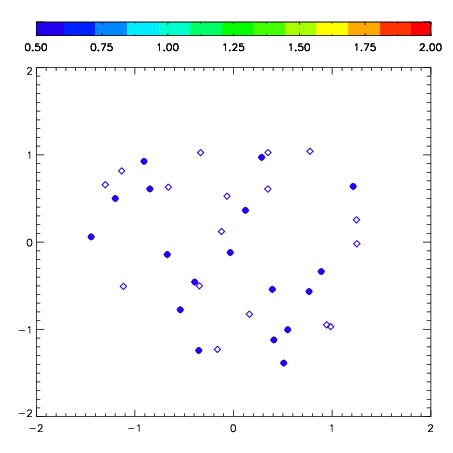
| Frame | Nreads | Zeropoints | Mag plots | Spatial mag deviation | Spatial sky 16325A emission deviations (filled: sky, open: star) | Spatial sky continuum emission | Spatial sky telluric CO2 absorption deviations (filled: H < 10) | |||||||||||||||||||||||
| 0 | 0 |
|
|
|
|
|
|
| IPAIR | NAME | SHIFT | NEWSHIFT | S/N | NAME | SHIFT | NEWSHIFT | S/N |
| 0 | 07040054 | 0.428253 | 0.00000 | 146.224 | 07040055 | 0.0173848 | 0.410868 | 147.617 |
| 1 | 07040050 | 0.402506 | 0.0257470 | 178.642 | 07040048 | 0.00000 | 0.428253 | 195.292 |
| 2 | 07040049 | 0.404108 | 0.0241450 | 169.599 | 07040051 | 0.0138038 | 0.414449 | 183.525 |
| 3 | 07040053 | 0.414495 | 0.0137580 | 159.911 | 07040052 | 0.0142252 | 0.414028 | 170.047 |