| Red | Green | Blue | |
| z | 17.64 | ||
| znorm | Inf | ||
| sky | -Inf | -Inf | -Inf |
| S/N | 29.3 | 46.2 | 55.2 |
| S/N(c) | 0.0 | 0.0 | 0.0 |
| SN(E/C) |

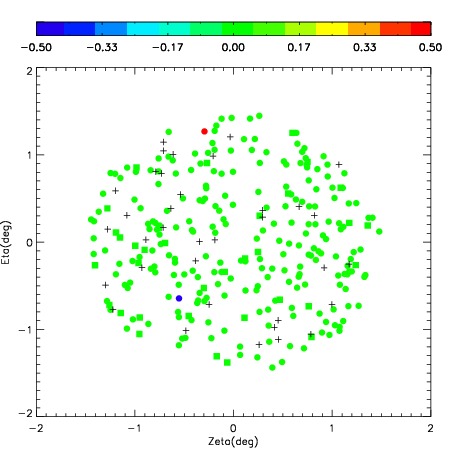

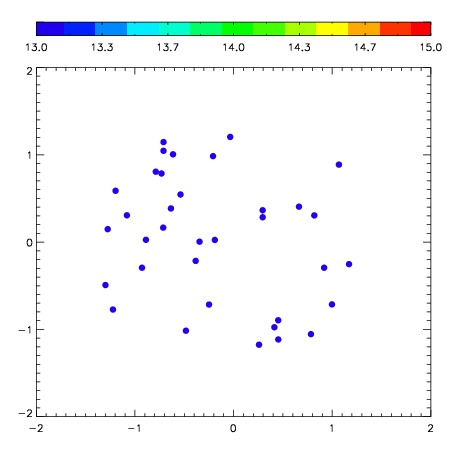
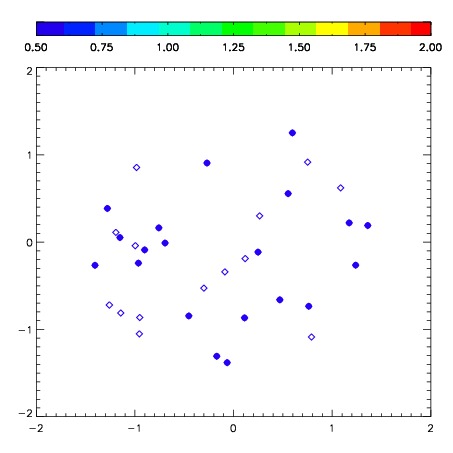
| Frame | Nreads | Zeropoints | Mag plots | Spatial mag deviation | Spatial sky 16325A emission deviations (filled: sky, open: star) | Spatial sky continuum emission | Spatial sky telluric CO2 absorption deviations (filled: H < 10) | |||||||||||||||||||||||
| 0 | 0 |
|
|
|
|
|
|
| IPAIR | NAME | SHIFT | NEWSHIFT | S/N | NAME | SHIFT | NEWSHIFT | S/N |
| 0 | 06660080 | 0.426259 | 0.00000 | 252.543 | 06660078 | 0.00000 | 0.426259 | 0.00000 |
| 1 | 06660079 | 0.419112 | 0.00714701 | 283.081 | 06660081 | 0.00261253 | 0.423646 | 284.526 |
| 2 | 06660084 | 0.419965 | 0.00629401 | 279.946 | 06660082 | -0.00213385 | 0.428393 | 277.350 |
| 3 | 06660083 | 0.419326 | 0.00693300 | 277.903 | 06660085 | -0.00171295 | 0.427972 | 276.417 |