| Red | Green | Blue | |
| z | 17.64 | ||
| znorm | Inf | ||
| sky | -Inf | -Inf | -Inf |
| S/N | 26.1 | 43.8 | 50.4 |
| S/N(c) | 0.0 | 0.0 | 0.0 |
| SN(E/C) |

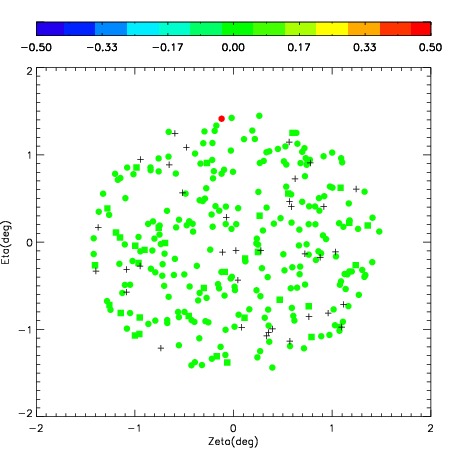
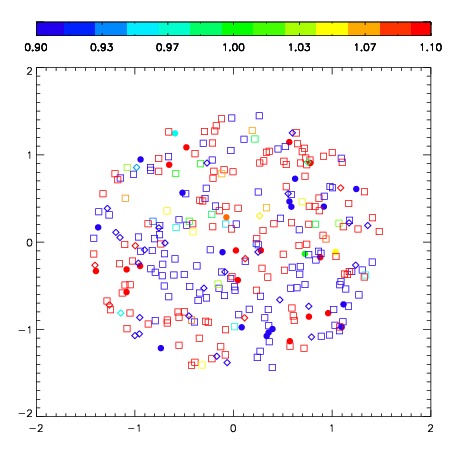

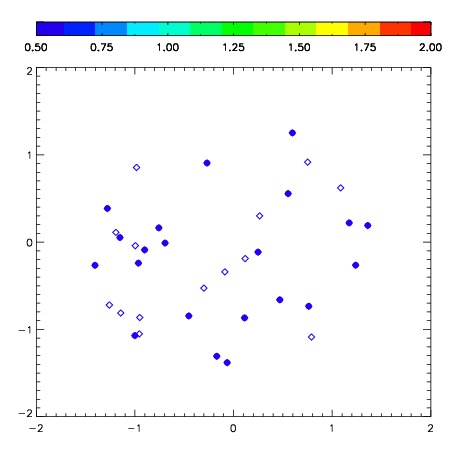
| Frame | Nreads | Zeropoints | Mag plots | Spatial mag deviation | Spatial sky 16325A emission deviations (filled: sky, open: star) | Spatial sky continuum emission | Spatial sky telluric CO2 absorption deviations (filled: H < 10) | |||||||||||||||||||||||
| 0 | 0 |
|
|
|
|
|
|
| IPAIR | NAME | SHIFT | NEWSHIFT | S/N | NAME | SHIFT | NEWSHIFT | S/N |
| 0 | 06410095 | 0.611978 | 0.00000 | 160.560 | 06410094 | 0.154493 | 0.457485 | 151.382 |
| 1 | 06410096 | 0.608531 | 0.00344700 | 167.041 | 06410090 | 0.00000 | 0.611978 | 168.323 |
| 2 | 06410091 | 0.606931 | 0.00504702 | 166.487 | 06410097 | 0.149330 | 0.462648 | 167.213 |
| 3 | 06410092 | 0.606392 | 0.00558597 | 160.997 | 06410093 | 0.149330 | 0.462648 | 162.877 |