| Red | Green | Blue | |
| z | 17.64 | ||
| znorm | Inf | ||
| sky | -NaN | -Inf | -Inf |
| S/N | 26.6 | 42.8 | 54.9 |
| S/N(c) | 0.0 | 0.0 | 0.0 |
| SN(E/C) |

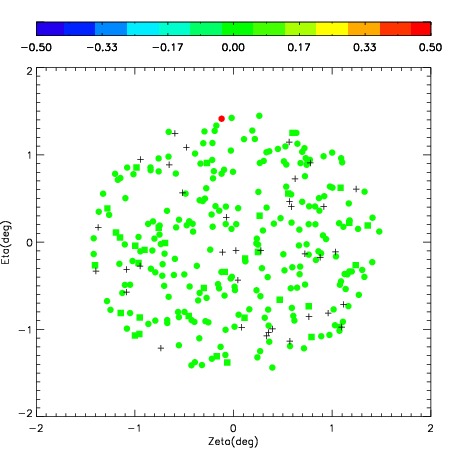
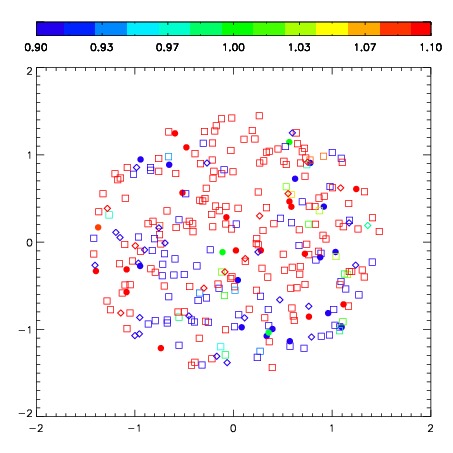

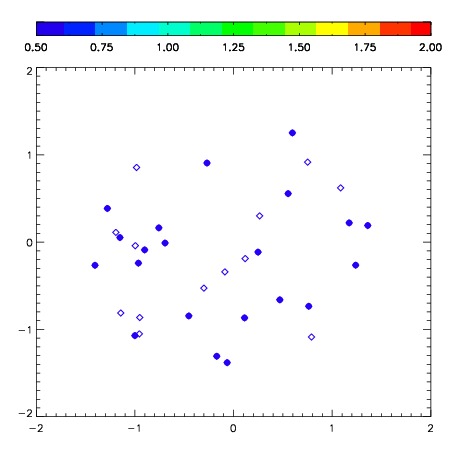
| Frame | Nreads | Zeropoints | Mag plots | Spatial mag deviation | Spatial sky 16325A emission deviations (filled: sky, open: star) | Spatial sky continuum emission | Spatial sky telluric CO2 absorption deviations (filled: H < 10) | |||||||||||||||||||||||
| 0 | 0 |
|
|
|
|
|
|
| IPAIR | NAME | SHIFT | NEWSHIFT | S/N | NAME | SHIFT | NEWSHIFT | S/N |
| 0 | 06680078 | 0.650636 | 0.00000 | 160.330 | 06680079 | 0.150070 | 0.500566 | 161.140 |
| 1 | 06680081 | 0.636341 | 0.0142950 | 168.591 | 06680083 | 0.156024 | 0.494612 | 169.198 |
| 2 | 06680082 | 0.645815 | 0.00482100 | 166.621 | 06680080 | 0.151236 | 0.499400 | 165.955 |
| 3 | 06680077 | 0.648489 | 0.00214702 | 163.160 | 06680076 | 0.00000 | 0.650636 | 162.927 |