| Red | Green | Blue | |
| z | 17.64 | ||
| znorm | Inf | ||
| sky | -NaN | -NaN | -Inf |
| S/N | 32.2 | 54.5 | 62.7 |
| S/N(c) | 0.0 | 0.0 | 0.0 |
| SN(E/C) |

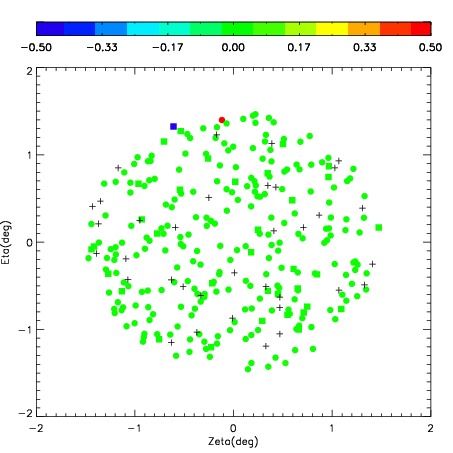
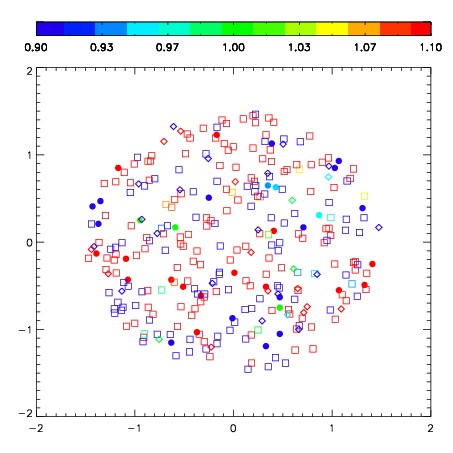


| Frame | Nreads | Zeropoints | Mag plots | Spatial mag deviation | Spatial sky 16325A emission deviations (filled: sky, open: star) | Spatial sky continuum emission | Spatial sky telluric CO2 absorption deviations (filled: H < 10) | |||||||||||||||||||||||
| 0 | 0 |
|
|
|
|
|
|
| IPAIR | NAME | SHIFT | NEWSHIFT | S/N | NAME | SHIFT | NEWSHIFT | S/N |
| 0 | 07870034 | 0.478037 | 0.00000 | 224.519 | 07870033 | 0.0445369 | 0.433500 | 227.554 |
| 1 | 07870035 | 0.464008 | 0.0140290 | 284.020 | 07870036 | 0.0589882 | 0.419049 | 280.297 |
| 2 | 07870031 | 0.454496 | 0.0235410 | 275.837 | 07870032 | 0.0456973 | 0.432340 | 275.341 |
| 3 | 07870026 | 0.461006 | 0.0170310 | 273.925 | 07870029 | 0.0454022 | 0.432635 | 273.849 |
| 4 | 07870030 | 0.459881 | 0.0181560 | 273.652 | 07870025 | 0.00000 | 0.478037 | 271.141 |
| 5 | 07870027 | 0.458020 | 0.0200170 | 271.451 | 07870028 | 0.0447726 | 0.433264 | 265.497 |
| 6 | 07870038 | 0.464869 | 0.0131680 | 221.172 | 07870037 | 0.0476944 | 0.430343 | 214.300 |