| Red | Green | Blue | |
| z | 17.64 | ||
| znorm | Inf | ||
| sky | -Inf | -Inf | -Inf |
| S/N | 29.3 | 47.2 | 60.4 |
| S/N(c) | 0.0 | 0.0 | 0.0 |
| SN(E/C) |
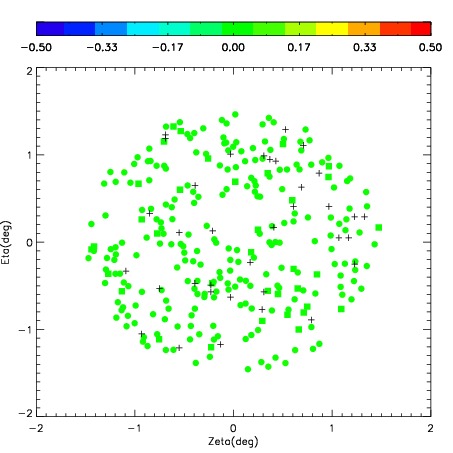
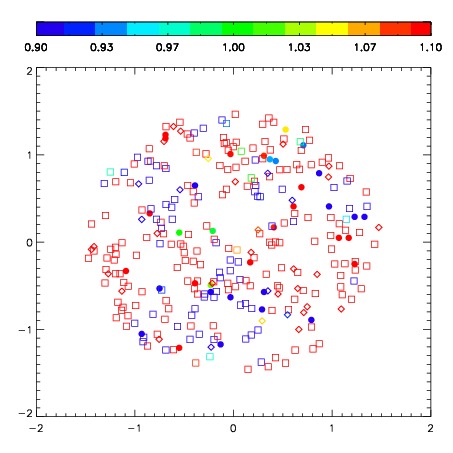
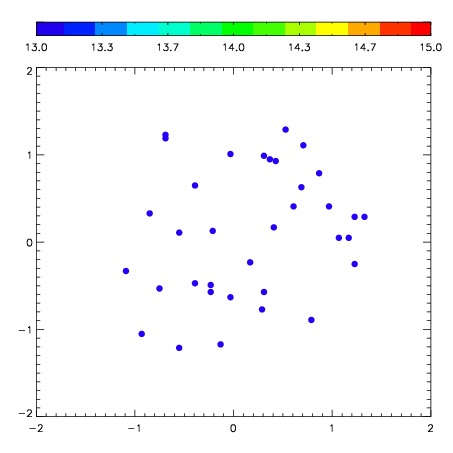
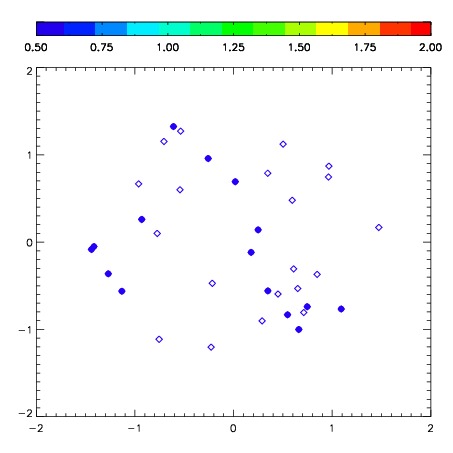
| Frame | Nreads | Zeropoints | Mag plots | Spatial mag deviation | Spatial sky 16325A emission deviations (filled: sky, open: star) | Spatial sky continuum emission | Spatial sky telluric CO2 absorption deviations (filled: H < 10) | |||||||||||||||||||||||
| 0 | 0 |
|
|
|
|
|
|
| IPAIR | NAME | SHIFT | NEWSHIFT | S/N | NAME | SHIFT | NEWSHIFT | S/N |
| 0 | 07510049 | 0.464579 | 0.00000 | 209.368 | 07510054 | 0.0301290 | 0.434450 | 209.337 |
| 1 | 07510056 | 0.455816 | 0.00876299 | 221.462 | 07510058 | 0.0268602 | 0.437719 | 220.832 |
| 2 | 07510057 | 0.458435 | 0.00614399 | 220.010 | 07510055 | 0.0309310 | 0.433648 | 215.649 |
| 3 | 07510053 | 0.463345 | 0.00123399 | 205.175 | 07510051 | 0.0307674 | 0.433812 | 205.756 |
| 4 | 07510048 | 0.447648 | 0.0169310 | 204.087 | 07510050 | 0.0304962 | 0.434083 | 205.217 |
| 5 | 07510052 | 0.453340 | 0.0112390 | 198.990 | 07510047 | 0.00000 | 0.464579 | 199.418 |