| Red | Green | Blue | |
| z | 17.64 | ||
| znorm | Inf | ||
| sky | -NaN | -Inf | -NaN |
| S/N | 19.8 | 31.2 | 39.0 |
| S/N(c) | 0.0 | 0.0 | 0.0 |
| SN(E/C) |
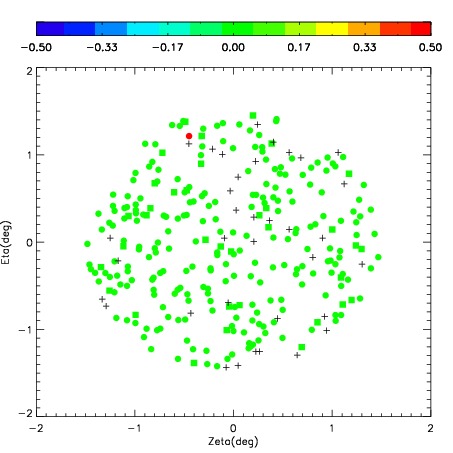

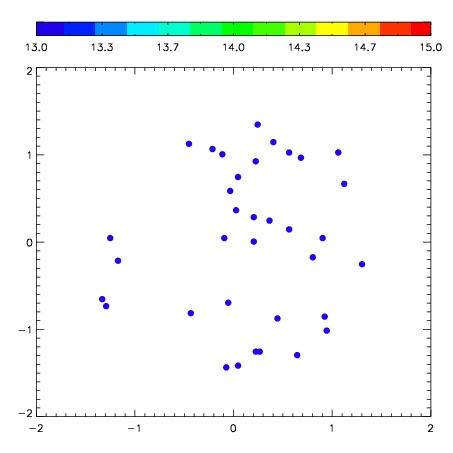
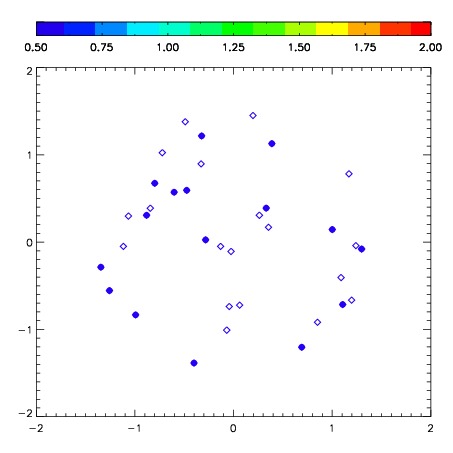
| Frame | Nreads | Zeropoints | Mag plots | Spatial mag deviation | Spatial sky 16325A emission deviations (filled: sky, open: star) | Spatial sky continuum emission | Spatial sky telluric CO2 absorption deviations (filled: H < 10) | |||||||||||||||||||||||
| 0 | 0 |
|
|
|
|
|
|
| IPAIR | NAME | SHIFT | NEWSHIFT | S/N | NAME | SHIFT | NEWSHIFT | S/N |
| 0 | 06740070 | 0.512820 | 0.00000 | 200.146 | 06740069 | 0.00000 | 0.512820 | 190.001 |
| 1 | 06740071 | 0.511549 | 0.00127101 | 205.122 | 06740072 | 0.0661418 | 0.446678 | 196.111 |