| Red | Green | Blue | |
| z | 17.64 | ||
| znorm | Inf | ||
| sky | -NaN | -Inf | -Inf |
| S/N | 19.4 | 35.2 | 37.5 |
| S/N(c) | 0.0 | 0.0 | 0.0 |
| SN(E/C) |


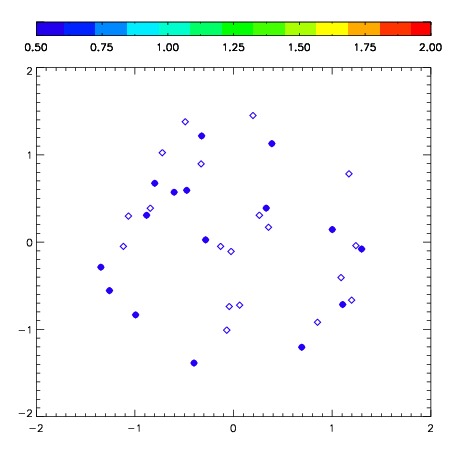
| Frame | Nreads | Zeropoints | Mag plots | Spatial mag deviation | Spatial sky 16325A emission deviations (filled: sky, open: star) | Spatial sky continuum emission | Spatial sky telluric CO2 absorption deviations (filled: H < 10) | |||||||||||||||||||||||
| 0 | 0 |
|
|
|
|
|
|
| IPAIR | NAME | SHIFT | NEWSHIFT | S/N | NAME | SHIFT | NEWSHIFT | S/N |
| 0 | 06770041 | 0.492088 | 0.00000 | 193.084 | 06770040 | 0.0403542 | 0.451734 | 168.683 |
| 1 | 06770042 | 0.482663 | 0.00942498 | 242.760 | 06770036 | 0.00000 | 0.492088 | 259.913 |
| 2 | 06770037 | 0.479084 | 0.0130040 | 214.457 | 06770043 | 0.0336840 | 0.458404 | 220.029 |
| 3 | 06770038 | 0.483862 | 0.00822598 | 208.188 | 06770039 | 0.0430865 | 0.449001 | 179.940 |