| Red | Green | Blue | |
| z | 17.64 | ||
| znorm | Inf | ||
| sky | -NaN | -NaN | -Inf |
| S/N | 24.3 | 41.8 | 45.5 |
| S/N(c) | 0.0 | 0.0 | 0.0 |
| SN(E/C) |

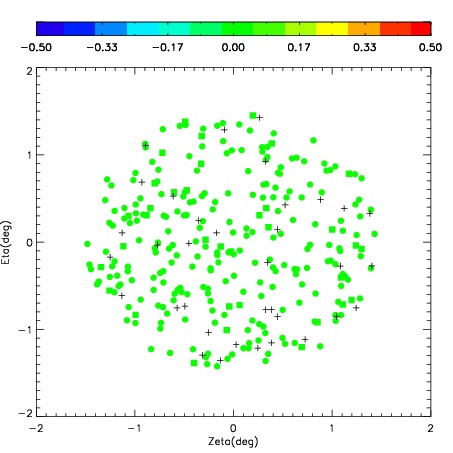

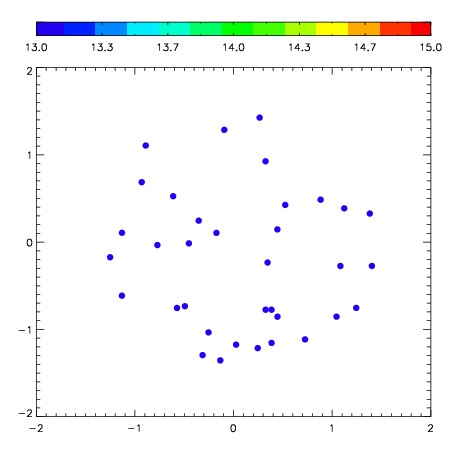
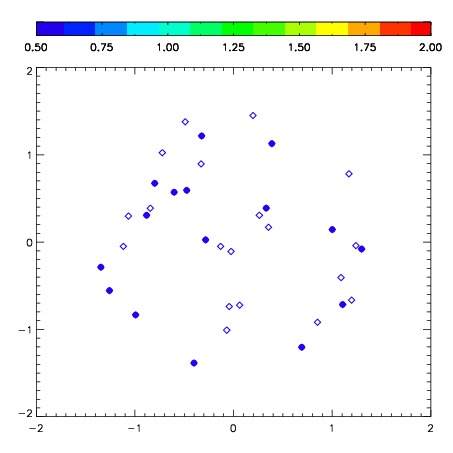
| Frame | Nreads | Zeropoints | Mag plots | Spatial mag deviation | Spatial sky 16325A emission deviations (filled: sky, open: star) | Spatial sky continuum emission | Spatial sky telluric CO2 absorption deviations (filled: H < 10) | |||||||||||||||||||||||
| 0 | 0 |
|
|
|
|
|
|
| IPAIR | NAME | SHIFT | NEWSHIFT | S/N | NAME | SHIFT | NEWSHIFT | S/N |
| 0 | 07030049 | 0.208862 | 0.00000 | 296.957 | 07030047 | 0.00000 | 0.208862 | 297.251 |
| 1 | 07030048 | 0.191726 | 0.0171360 | 299.476 | 07030050 | -0.109999 | 0.318861 | 298.074 |
| 2 | 07030053 | 0.204699 | 0.00416301 | 291.650 | 07030054 | -0.125647 | 0.334509 | 296.193 |
| 3 | 07030056 | 0.195208 | 0.0136540 | 290.618 | 07030055 | -0.119061 | 0.327923 | 295.934 |
| 4 | 07030052 | 0.198204 | 0.0106580 | 277.750 | 07030051 | -0.108833 | 0.317695 | 292.360 |