| Red | Green | Blue | |
| z | 17.64 | ||
| znorm | Inf | ||
| sky | -Inf | -NaN | -Inf |
| S/N | 27.9 | 46.8 | 51.8 |
| S/N(c) | 0.0 | 0.0 | 0.0 |
| SN(E/C) |

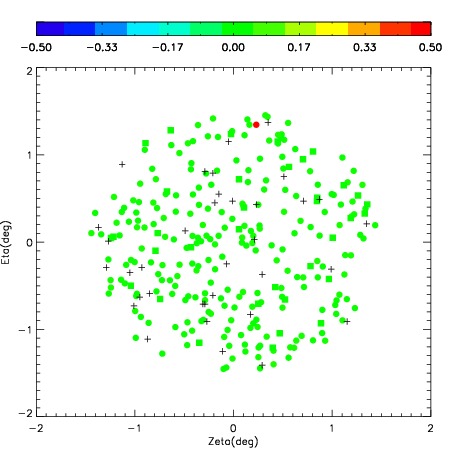
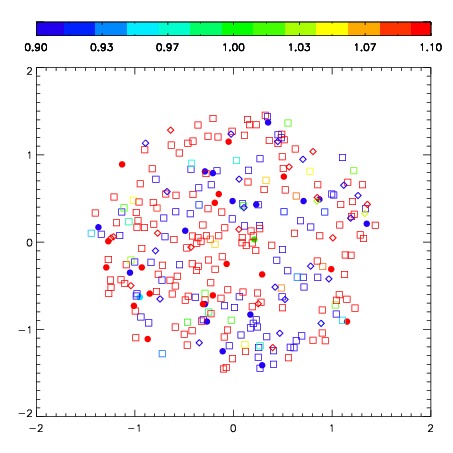
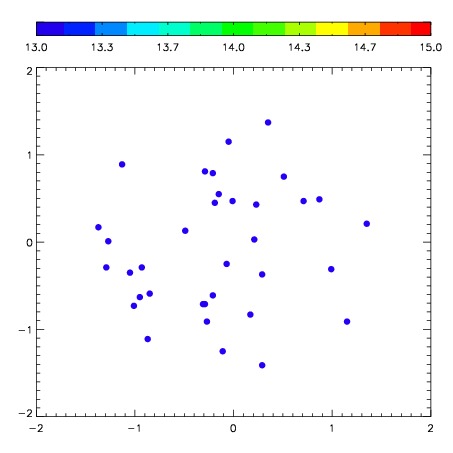
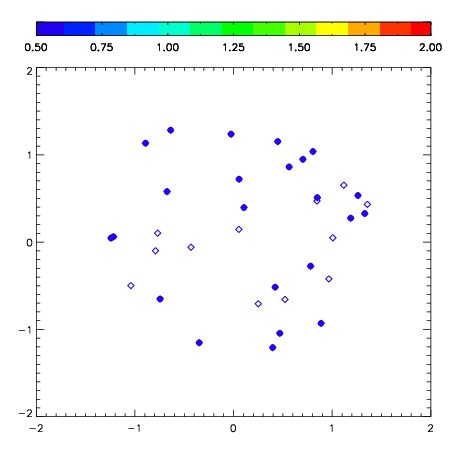
| Frame | Nreads | Zeropoints | Mag plots | Spatial mag deviation | Spatial sky 16325A emission deviations (filled: sky, open: star) | Spatial sky continuum emission | Spatial sky telluric CO2 absorption deviations (filled: H < 10) | |||||||||||||||||||||||
| 0 | 0 |
|
|
|
|
|
|
| IPAIR | NAME | SHIFT | NEWSHIFT | S/N | NAME | SHIFT | NEWSHIFT | S/N |
| 0 | 06940092 | 0.533602 | 0.00000 | 283.215 | 06940091 | 0.101379 | 0.432223 | 281.857 |
| 1 | 06940093 | 0.532419 | 0.00118297 | 286.433 | 06940094 | 0.105760 | 0.427842 | 282.762 |
| 2 | 06940089 | 0.524963 | 0.00863898 | 280.271 | 06940090 | 0.104498 | 0.429104 | 280.807 |
| 3 | 06940088 | 0.530100 | 0.00350201 | 275.935 | 06940087 | 0.00000 | 0.533602 | 274.565 |