| Red | Green | Blue | |
| z | 17.64 | ||
| znorm | Inf | ||
| sky | -Inf | -Inf | -Inf |
| S/N | 22.9 | 38.1 | 44.9 |
| S/N(c) | 0.0 | 0.0 | 0.0 |
| SN(E/C) |


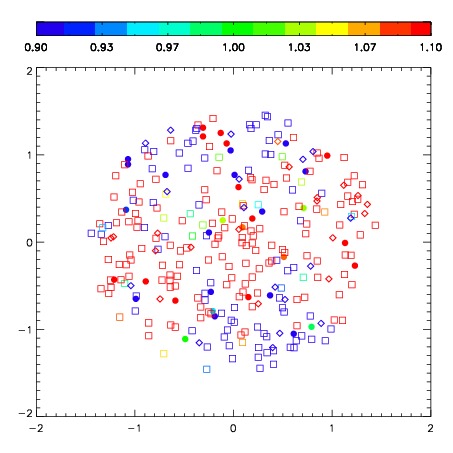
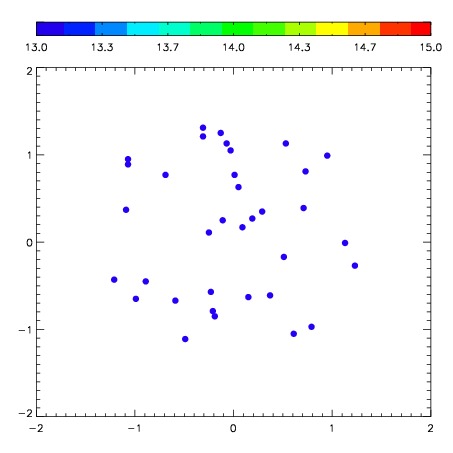
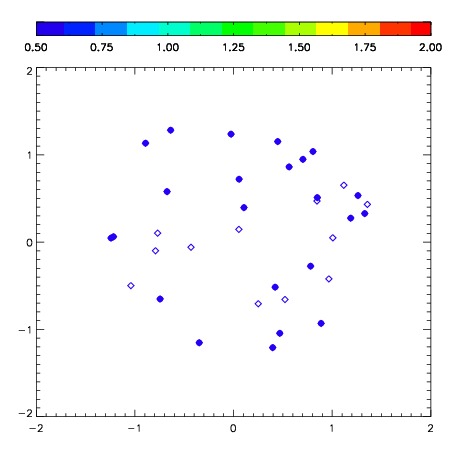
| Frame | Nreads | Zeropoints | Mag plots | Spatial mag deviation | Spatial sky 16325A emission deviations (filled: sky, open: star) | Spatial sky continuum emission | Spatial sky telluric CO2 absorption deviations (filled: H < 10) | |||||||||||||||||||||||
| 0 | 0 |
|
|
|
|
|
|
| IPAIR | NAME | SHIFT | NEWSHIFT | S/N | NAME | SHIFT | NEWSHIFT | S/N |
| 0 | 07020064 | 0.497165 | 0.00000 | 188.525 | 07020062 | 0.0477918 | 0.449373 | 190.044 |
| 1 | 07020065 | 0.494935 | 0.00222999 | 192.754 | 07020066 | 0.0527704 | 0.444395 | 192.334 |
| 2 | 07020061 | 0.489194 | 0.00797099 | 187.129 | 07020063 | 0.0475795 | 0.449585 | 185.291 |
| 3 | 07020060 | 0.484739 | 0.0124260 | 185.936 | 07020059 | 0.00000 | 0.497165 | 183.686 |