| Red | Green | Blue | |
| z | 17.64 | ||
| znorm | Inf | ||
| sky | -Inf | -Inf | -Inf |
| S/N | 29.0 | 47.7 | 51.6 |
| S/N(c) | 0.0 | 0.0 | 0.0 |
| SN(E/C) |

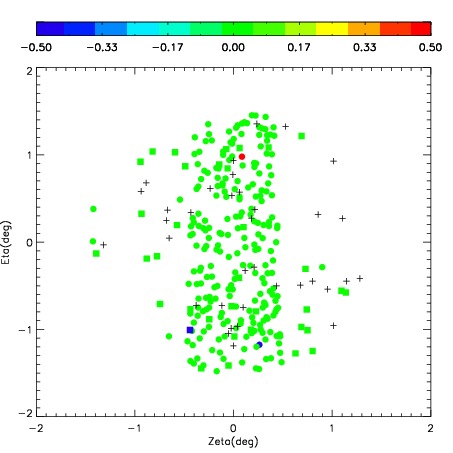

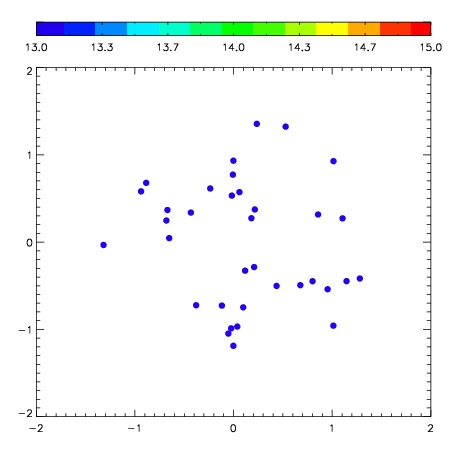
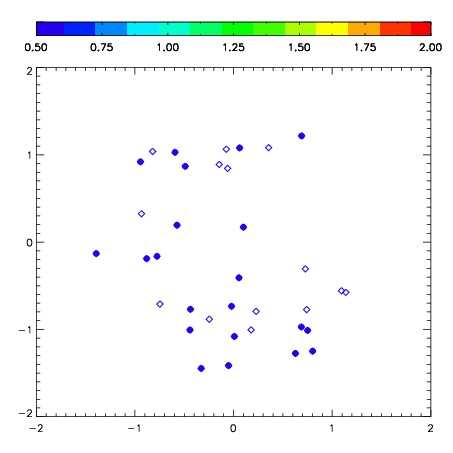
| Frame | Nreads | Zeropoints | Mag plots | Spatial mag deviation | Spatial sky 16325A emission deviations (filled: sky, open: star) | Spatial sky continuum emission | Spatial sky telluric CO2 absorption deviations (filled: H < 10) | |||||||||||||||||||||||
| 0 | 0 |
|
|
|
|
|
|
| IPAIR | NAME | SHIFT | NEWSHIFT | S/N | NAME | SHIFT | NEWSHIFT | S/N |
| 0 | 06920031 | 0.423864 | 0.00000 | 231.831 | 06920029 | -0.0123450 | 0.436209 | 230.487 |
| 1 | 06920032 | 0.417621 | 0.00624302 | 233.594 | 06920030 | -0.0269726 | 0.450837 | 231.862 |
| 2 | 06920027 | 0.415268 | 0.00859600 | 232.682 | 06920033 | -0.0168241 | 0.440688 | 231.167 |
| 3 | 06920028 | 0.418921 | 0.00494301 | 231.195 | 06920026 | 0.00000 | 0.423864 | 227.966 |