| Red | Green | Blue | |
| z | 17.64 | ||
| znorm | Inf | ||
| sky | -Inf | -Inf | -Inf |
| S/N | 14.3 | 26.5 | 31.4 |
| S/N(c) | 0.0 | 0.0 | 0.0 |
| SN(E/C) |

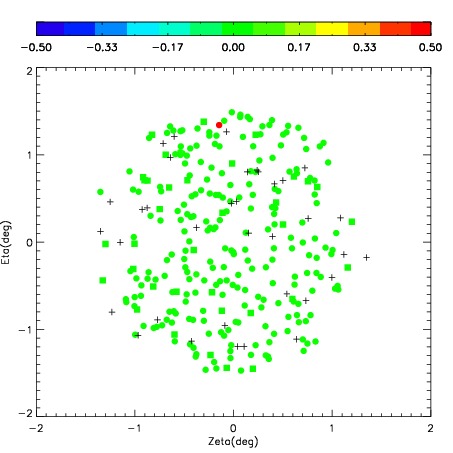

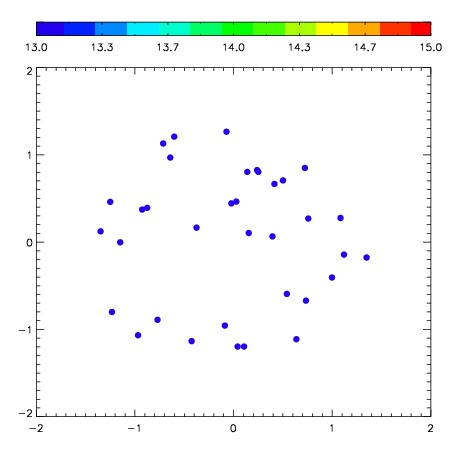
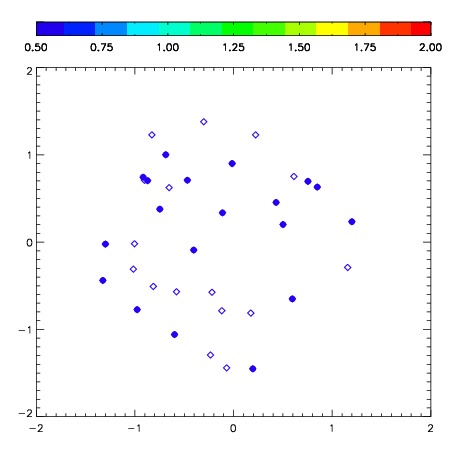
| Frame | Nreads | Zeropoints | Mag plots | Spatial mag deviation | Spatial sky 16325A emission deviations (filled: sky, open: star) | Spatial sky continuum emission | Spatial sky telluric CO2 absorption deviations (filled: H < 10) | |||||||||||||||||||||||
| 0 | 0 |
|
|
|
|
|
|
| IPAIR | NAME | SHIFT | NEWSHIFT | S/N | NAME | SHIFT | NEWSHIFT | S/N |
| 0 | 06900031 | 0.466412 | 0.00000 | 154.823 | 06900033 | 0.0155391 | 0.450873 | 106.873 |
| 1 | 06900023 | 0.453196 | 0.0132160 | 226.088 | 06900026 | 0.00898021 | 0.457432 | 234.205 |
| 2 | 06900028 | 0.457337 | 0.00907502 | 204.022 | 06900030 | 0.0138332 | 0.452579 | 183.424 |
| 3 | 06900024 | 0.457414 | 0.00899801 | 181.152 | 06900029 | 0.0176674 | 0.448745 | 169.605 |
| 4 | 06900027 | 0.465389 | 0.00102299 | 159.595 | 06900022 | 0.00000 | 0.466412 | 165.068 |
| 5 | 06900032 | 0.465525 | 0.000887007 | 155.530 | 06900025 | 0.0107128 | 0.455699 | 144.956 |