| Red | Green | Blue | |
| z | 17.64 | ||
| znorm | Inf | ||
| sky | -NaN | -NaN | -Inf |
| S/N | 27.3 | 44.7 | 50.2 |
| S/N(c) | 0.0 | 0.0 | 0.0 |
| SN(E/C) |


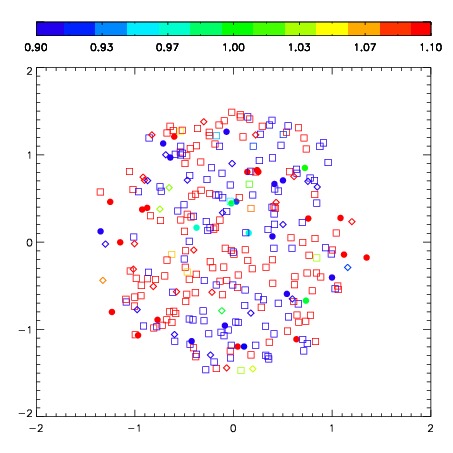

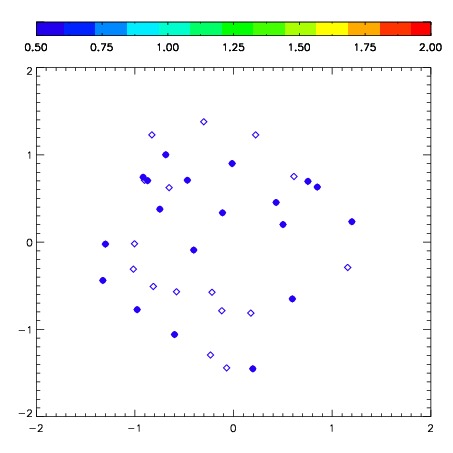
| Frame | Nreads | Zeropoints | Mag plots | Spatial mag deviation | Spatial sky 16325A emission deviations (filled: sky, open: star) | Spatial sky continuum emission | Spatial sky telluric CO2 absorption deviations (filled: H < 10) | |||||||||||||||||||||||
| 0 | 0 |
|
|
|
|
|
|
| IPAIR | NAME | SHIFT | NEWSHIFT | S/N | NAME | SHIFT | NEWSHIFT | S/N |
| 0 | 06940028 | 0.419437 | 0.00000 | 294.395 | 06940029 | 0.0199870 | 0.399450 | 296.677 |
| 1 | 06940031 | 0.419017 | 0.000420004 | 301.228 | 06940033 | 0.0234601 | 0.395977 | 302.387 |
| 2 | 06940032 | 0.418914 | 0.000523001 | 299.727 | 06940030 | 0.0228394 | 0.396598 | 297.462 |
| 3 | 06940027 | 0.418897 | 0.000539988 | 292.536 | 06940026 | 0.00000 | 0.419437 | 292.196 |