| Red | Green | Blue | |
| z | 17.64 | ||
| znorm | Inf | ||
| sky | -Inf | -NaN | -Inf |
| S/N | 23.1 | 40.1 | 42.5 |
| S/N(c) | 0.0 | 0.0 | 0.0 |
| SN(E/C) |

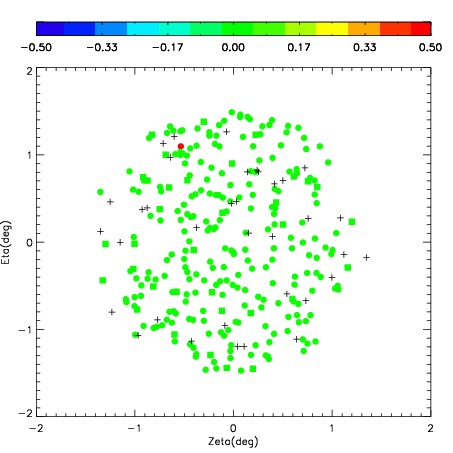
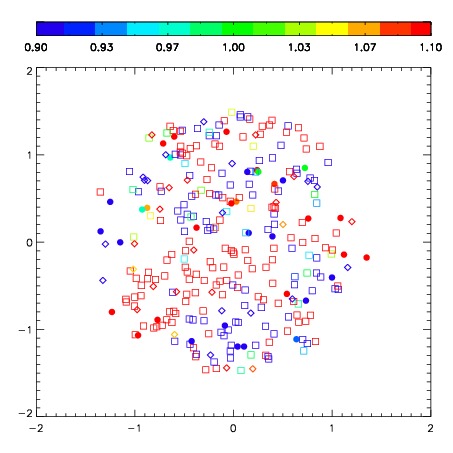
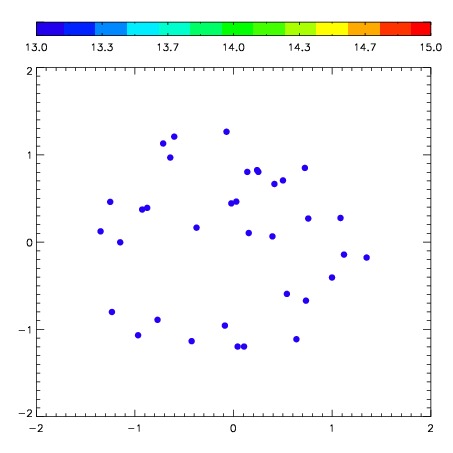
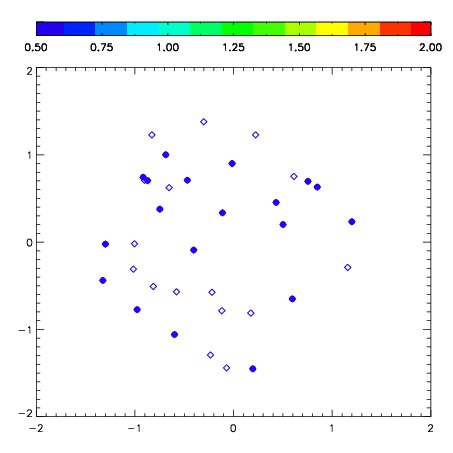
| Frame | Nreads | Zeropoints | Mag plots | Spatial mag deviation | Spatial sky 16325A emission deviations (filled: sky, open: star) | Spatial sky continuum emission | Spatial sky telluric CO2 absorption deviations (filled: H < 10) | |||||||||||||||||||||||
| 0 | 0 |
|
|
|
|
|
|
| IPAIR | NAME | SHIFT | NEWSHIFT | S/N | NAME | SHIFT | NEWSHIFT | S/N |
| 0 | 07200017 | 0.474008 | 0.00000 | 258.346 | 07200015 | 0.0496829 | 0.424325 | 271.154 |
| 1 | 07200016 | 0.468628 | 0.00538000 | 283.514 | 07200011 | 0.00000 | 0.474008 | 278.729 |
| 2 | 07200013 | 0.469045 | 0.00496298 | 259.947 | 07200018 | 0.0474457 | 0.426562 | 277.979 |
| 3 | 07200012 | 0.470589 | 0.00341898 | 249.979 | 07200014 | 0.0490147 | 0.424993 | 271.091 |