| Red | Green | Blue | |
| z | 17.64 | ||
| znorm | Inf | ||
| sky | -Inf | -Inf | -Inf |
| S/N | 19.8 | 36.5 | 38.3 |
| S/N(c) | 0.0 | 0.0 | 0.0 |
| SN(E/C) |

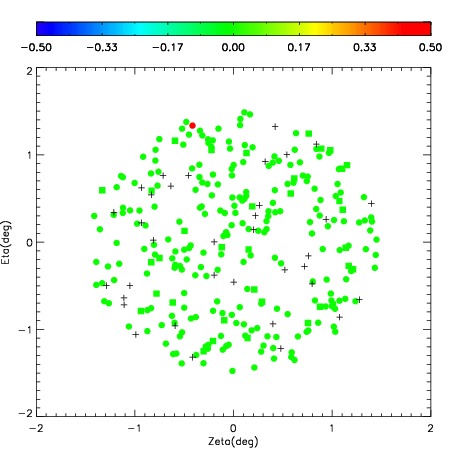
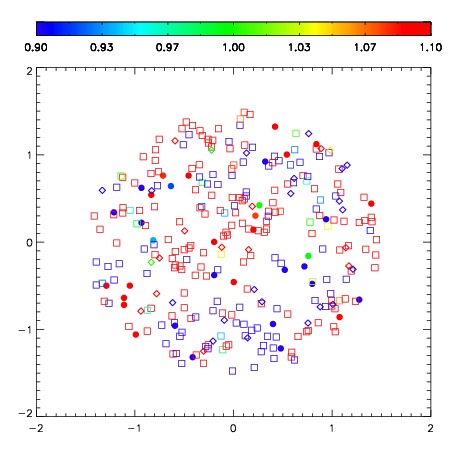


| Frame | Nreads | Zeropoints | Mag plots | Spatial mag deviation | Spatial sky 16325A emission deviations (filled: sky, open: star) | Spatial sky continuum emission | Spatial sky telluric CO2 absorption deviations (filled: H < 10) | |||||||||||||||||||||||
| 0 | 0 |
|
|
|
|
|
|
| IPAIR | NAME | SHIFT | NEWSHIFT | S/N | NAME | SHIFT | NEWSHIFT | S/N |
| 0 | 10610041 | 0.425249 | 0.00000 | 217.740 | 10610042 | -0.0301698 | 0.455419 | 217.395 |
| 1 | 10610040 | 0.418602 | 0.00664702 | 183.926 | 10610043 | -0.0323600 | 0.457609 | 203.283 |
| 2 | 10610045 | 0.419312 | 0.00593701 | 181.542 | 10610039 | 0.00000 | 0.425249 | 176.705 |
| 3 | 10610044 | 0.412568 | 0.0126810 | 178.792 | 10610046 | -0.0312344 | 0.456483 | 170.207 |