| Red | Green | Blue | |
| z | 17.64 | ||
| znorm | Inf | ||
| sky | -Inf | -Inf | -Inf |
| S/N | 4.4 | 7.5 | 8.1 |
| S/N(c) | 0.0 | 0.0 | 0.0 |
| SN(E/C) |
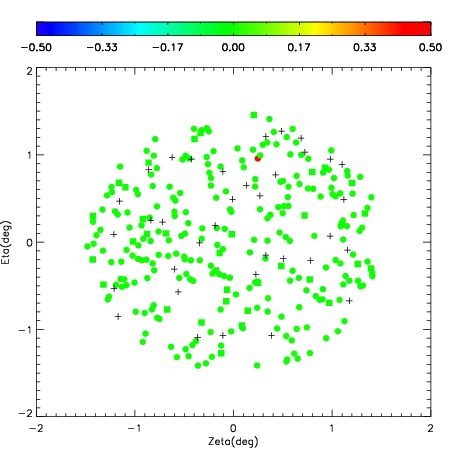
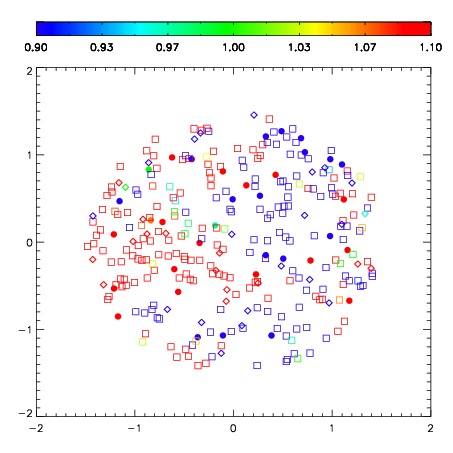

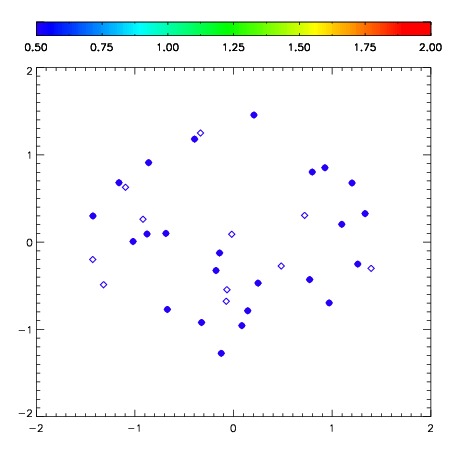
| Frame | Nreads | Zeropoints | Mag plots | Spatial mag deviation | Spatial sky 16325A emission deviations (filled: sky, open: star) | Spatial sky continuum emission | Spatial sky telluric CO2 absorption deviations (filled: H < 10) | |||||||||||||||||||||||
| 0 | 0 |
|
|
|
|
|
|
| IPAIR | NAME | SHIFT | NEWSHIFT | S/N | NAME | SHIFT | NEWSHIFT | S/N |
| 0 | 10540086 | 0.509387 | 0.00000 | 51.4940 | 10540088 | 0.0402039 | 0.469183 | 30.6088 |
| 1 | 10540082 | 0.491193 | 0.0181940 | 120.266 | 10540081 | 0.00000 | 0.509387 | 95.8171 |
| 2 | 10540083 | 0.497533 | 0.0118540 | 113.132 | 10540084 | 0.0311813 | 0.478206 | 89.3709 |
| 3 | 10540087 | 0.500958 | 0.00842899 | 96.1796 | 10540085 | 0.0347697 | 0.474617 | 65.7537 |