| Red | Green | Blue | |
| z | 17.64 | ||
| znorm | Inf | ||
| sky | -NaN | -Inf | -Inf |
| S/N | 28.1 | 47.6 | 51.1 |
| S/N(c) | 0.0 | 0.0 | 0.0 |
| SN(E/C) |

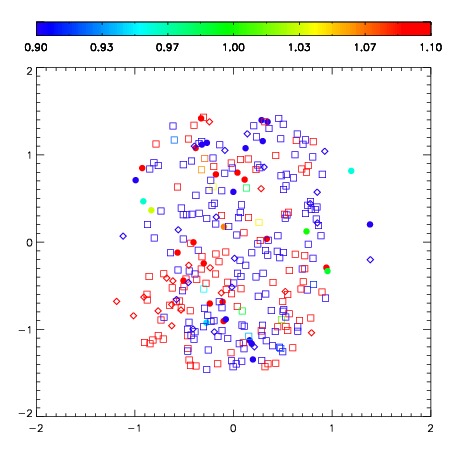


| Frame | Nreads | Zeropoints | Mag plots | Spatial mag deviation | Spatial sky 16325A emission deviations (filled: sky, open: star) | Spatial sky continuum emission | Spatial sky telluric CO2 absorption deviations (filled: H < 10) | |||||||||||||||||||||||
| 0 | 0 |
|
|
|
|
|
|
| IPAIR | NAME | SHIFT | NEWSHIFT | S/N | NAME | SHIFT | NEWSHIFT | S/N |
| 0 | 10260059 | 0.403693 | 0.00000 | 241.884 | 10260058 | 0.00000 | 0.403693 | 246.250 |
| 1 | 10260063 | 0.389700 | 0.0139930 | 240.624 | 10260062 | 0.0156367 | 0.388056 | 238.042 |
| 2 | 10260064 | 0.391475 | 0.0122180 | 237.977 | 10260065 | 0.0158710 | 0.387822 | 235.205 |
| 3 | 10260060 | 0.400085 | 0.00360799 | 230.634 | 10260061 | 0.0161560 | 0.387537 | 232.807 |