| Red | Green | Blue | |
| z | 17.64 | ||
| znorm | Inf | ||
| sky | -Inf | -Inf | -Inf |
| S/N | 29.0 | 51.4 | 54.5 |
| S/N(c) | 0.0 | 0.0 | 0.0 |
| SN(E/C) |
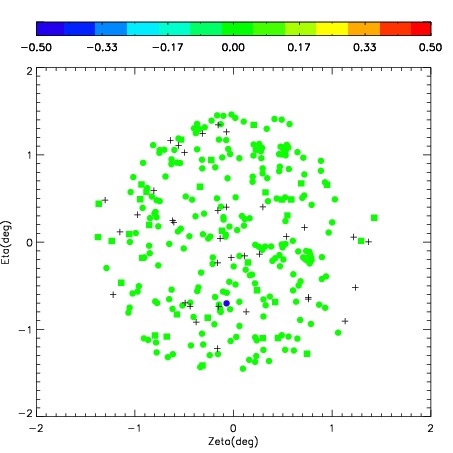

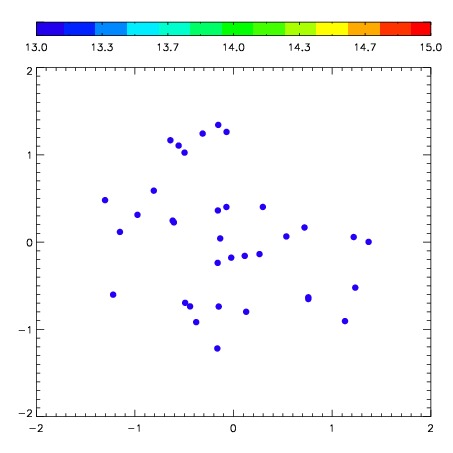
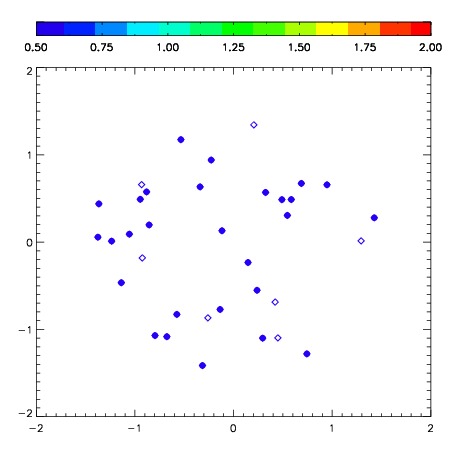
| Frame | Nreads | Zeropoints | Mag plots | Spatial mag deviation | Spatial sky 16325A emission deviations (filled: sky, open: star) | Spatial sky continuum emission | Spatial sky telluric CO2 absorption deviations (filled: H < 10) | |||||||||||||||||||||||
| 0 | 0 |
|
|
|
|
|
|
| IPAIR | NAME | SHIFT | NEWSHIFT | S/N | NAME | SHIFT | NEWSHIFT | S/N |
| 0 | 06950041 | 0.435504 | 0.00000 | 238.045 | 06950043 | 0.00173302 | 0.433771 | 233.594 |
| 1 | 06950037 | 0.428172 | 0.00733200 | 240.111 | 06950039 | 0.00220449 | 0.433300 | 239.921 |
| 2 | 06950042 | 0.433081 | 0.00242299 | 239.799 | 06950044 | 0.00419497 | 0.431309 | 235.686 |
| 3 | 06950045 | 0.431853 | 0.00365099 | 236.887 | 06950040 | 0.00318034 | 0.432324 | 231.251 |
| 4 | 06950038 | 0.428615 | 0.00688899 | 231.694 | 06950036 | 0.00000 | 0.435504 | 214.532 |