| Red | Green | Blue | |
| z | 17.64 | ||
| znorm | Inf | ||
| sky | -Inf | -Inf | -Inf |
| S/N | 35.3 | 60.8 | 65.6 |
| S/N(c) | 0.0 | 0.0 | 0.0 |
| SN(E/C) |


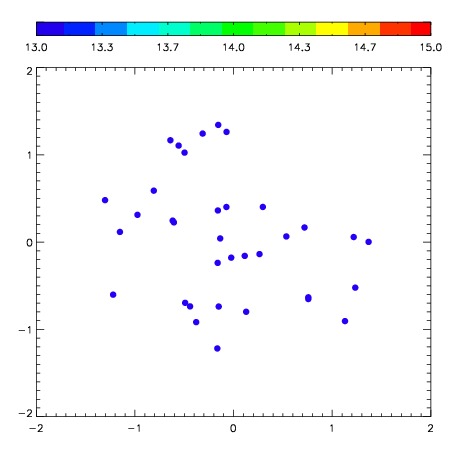
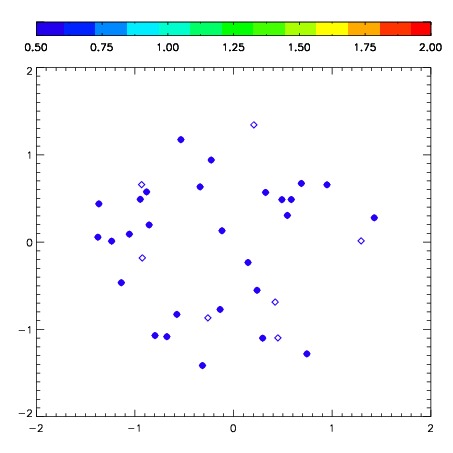
| Frame | Nreads | Zeropoints | Mag plots | Spatial mag deviation | Spatial sky 16325A emission deviations (filled: sky, open: star) | Spatial sky continuum emission | Spatial sky telluric CO2 absorption deviations (filled: H < 10) | |||||||||||||||||||||||
| 0 | 0 |
|
|
|
|
|
|
| IPAIR | NAME | SHIFT | NEWSHIFT | S/N | NAME | SHIFT | NEWSHIFT | S/N |
| 0 | 06990042 | 0.454532 | 0.00000 | 287.106 | 06990039 | 0.0254461 | 0.429086 | 284.098 |
| 1 | 06990045 | 0.446404 | 0.00812799 | 291.794 | 06990044 | 0.0258608 | 0.428671 | 293.756 |
| 2 | 06990046 | 0.448483 | 0.00604901 | 291.459 | 06990047 | 0.0262800 | 0.428252 | 290.414 |
| 3 | 06990041 | 0.444591 | 0.00994101 | 288.214 | 06990043 | 0.0250238 | 0.429508 | 289.961 |
| 4 | 06990038 | 0.452902 | 0.00163001 | 282.558 | 06990040 | 0.0273027 | 0.427229 | 282.456 |
| 5 | 06990037 | 0.446162 | 0.00837001 | 279.505 | 06990036 | 0.00000 | 0.454532 | 273.938 |