| Red | Green | Blue | |
| z | 17.64 | ||
| znorm | Inf | ||
| sky | -Inf | -Inf | -Inf |
| S/N | 16.2 | 27.5 | 30.9 |
| S/N(c) | 0.0 | 0.0 | 0.0 |
| SN(E/C) |

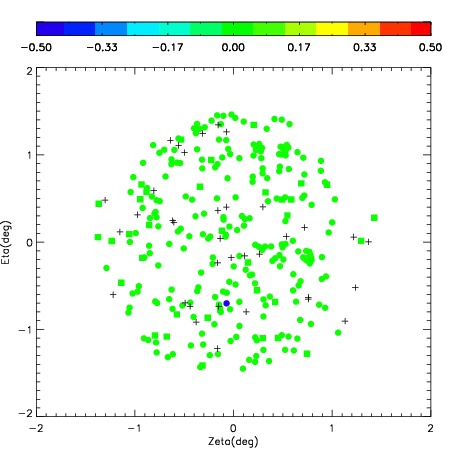
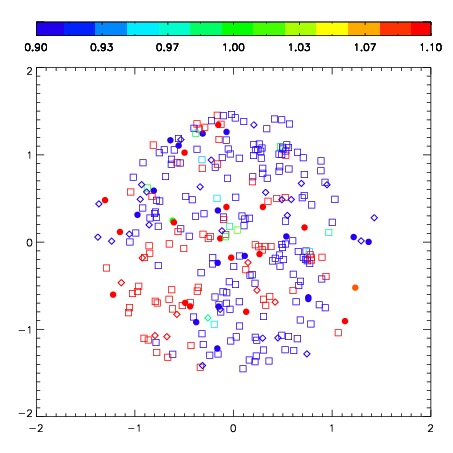
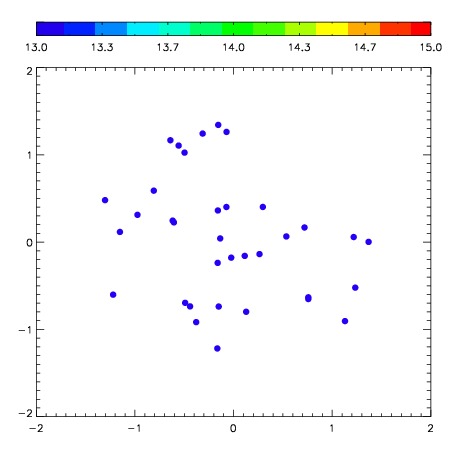

| Frame | Nreads | Zeropoints | Mag plots | Spatial mag deviation | Spatial sky 16325A emission deviations (filled: sky, open: star) | Spatial sky continuum emission | Spatial sky telluric CO2 absorption deviations (filled: H < 10) | |||||||||||||||||||||||
| 0 | 0 |
|
|
|
|
|
|
| IPAIR | NAME | SHIFT | NEWSHIFT | S/N | NAME | SHIFT | NEWSHIFT | S/N |
| 0 | 07260028 | 0.448026 | 0.00000 | 120.886 | 07260027 | 0.0342111 | 0.413815 | 132.416 |
| 1 | 07260029 | 0.406484 | 0.0415420 | 239.921 | 07260030 | 0.0252581 | 0.422768 | 243.997 |
| 2 | 07260025 | 0.418649 | 0.0293770 | 229.512 | 07260023 | 0.00000 | 0.448026 | 189.223 |
| 3 | 07260024 | 0.426485 | 0.0215410 | 201.042 | 07260026 | 0.0309441 | 0.417082 | 157.953 |