| Red | Green | Blue | |
| z | 17.64 | ||
| znorm | Inf | ||
| sky | -Inf | -Inf | -Inf |
| S/N | 24.7 | 42.3 | 45.9 |
| S/N(c) | 0.0 | 0.0 | 0.0 |
| SN(E/C) |
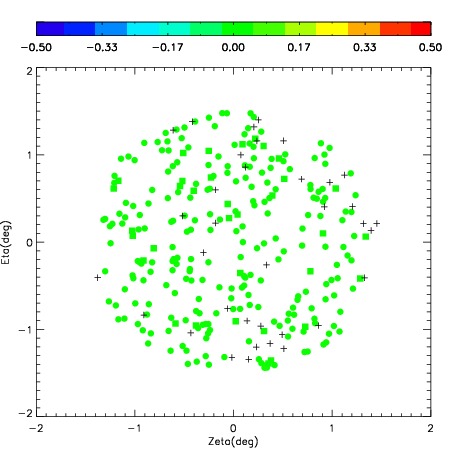
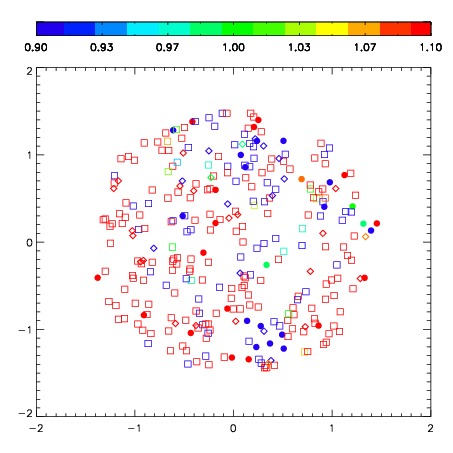
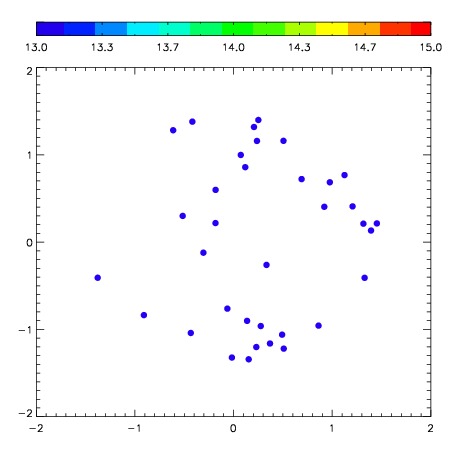

| Frame | Nreads | Zeropoints | Mag plots | Spatial mag deviation | Spatial sky 16325A emission deviations (filled: sky, open: star) | Spatial sky continuum emission | Spatial sky telluric CO2 absorption deviations (filled: H < 10) | |||||||||||||||||||||||
| 0 | 0 |
|
|
|
|
|
|
| IPAIR | NAME | SHIFT | NEWSHIFT | S/N | NAME | SHIFT | NEWSHIFT | S/N |
| 0 | 07510016 | 0.471970 | 0.00000 | 241.973 | 07510013 | 0.0261205 | 0.445849 | 250.304 |
| 1 | 07510012 | 0.468308 | 0.00366199 | 258.922 | 07510014 | 0.0239855 | 0.447984 | 260.517 |
| 2 | 07510011 | 0.471684 | 0.000285983 | 256.806 | 07510010 | 0.00000 | 0.471970 | 259.026 |
| 3 | 07510015 | 0.471246 | 0.000723988 | 251.553 | 07510017 | 0.0301277 | 0.441842 | 250.576 |