| Red | Green | Blue | |
| z | 17.64 | ||
| znorm | Inf | ||
| sky | -NaN | -NaN | -Inf |
| S/N | 25.5 | 44.7 | 49.4 |
| S/N(c) | 0.0 | 0.0 | 0.0 |
| SN(E/C) |


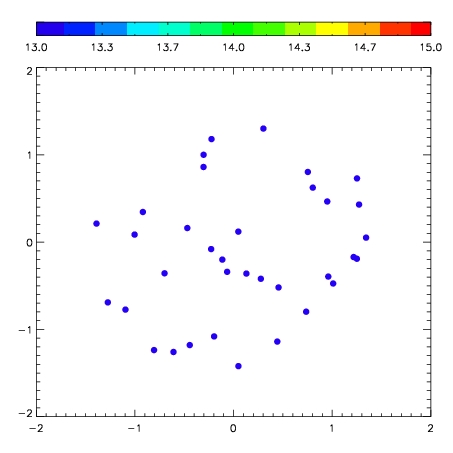
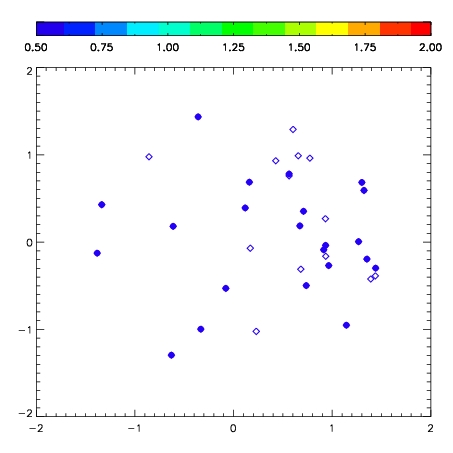
| Frame | Nreads | Zeropoints | Mag plots | Spatial mag deviation | Spatial sky 16325A emission deviations (filled: sky, open: star) | Spatial sky continuum emission | Spatial sky telluric CO2 absorption deviations (filled: H < 10) | |||||||||||||||||||||||
| 0 | 0 |
|
|
|
|
|
|
| IPAIR | NAME | SHIFT | NEWSHIFT | S/N | NAME | SHIFT | NEWSHIFT | S/N |
| 0 | 06940055 | 0.457378 | 0.00000 | 272.141 | 06940054 | 0.00929871 | 0.448079 | 272.092 |
| 1 | 06940052 | 0.455147 | 0.00223100 | 278.751 | 06940057 | 0.00737005 | 0.450008 | 274.441 |
| 2 | 06940056 | 0.455177 | 0.00220099 | 277.573 | 06940053 | 0.00590314 | 0.451475 | 272.615 |
| 3 | 06940051 | 0.449208 | 0.00817001 | 272.137 | 06940050 | 0.00000 | 0.457378 | 271.229 |