| Red | Green | Blue | |
| z | 17.64 | ||
| znorm | Inf | ||
| sky | -NaN | -NaN | -Inf |
| S/N | 26.1 | 45.5 | 48.8 |
| S/N(c) | 0.0 | 0.0 | 0.0 |
| SN(E/C) |
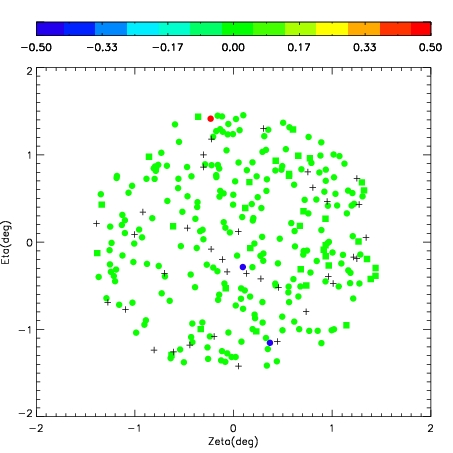
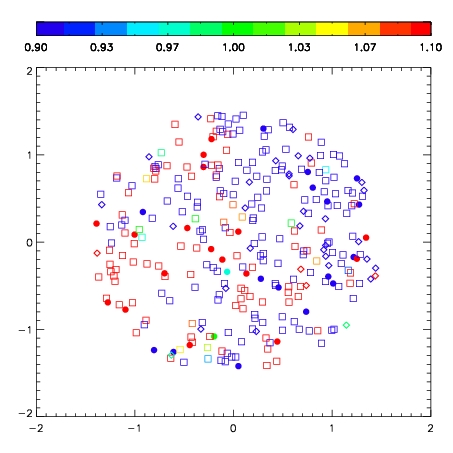

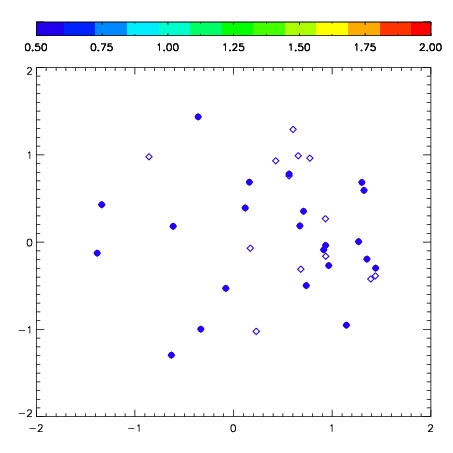
| Frame | Nreads | Zeropoints | Mag plots | Spatial mag deviation | Spatial sky 16325A emission deviations (filled: sky, open: star) | Spatial sky continuum emission | Spatial sky telluric CO2 absorption deviations (filled: H < 10) | |||||||||||||||||||||||
| 0 | 0 |
|
|
|
|
|
|
| IPAIR | NAME | SHIFT | NEWSHIFT | S/N | NAME | SHIFT | NEWSHIFT | S/N |
| 0 | 07260048 | 0.426273 | 0.00000 | 226.645 | 07260045 | 0.0355824 | 0.390691 | 245.091 |
| 1 | 07260040 | 0.415704 | 0.0105690 | 250.304 | 07260041 | 0.0315138 | 0.394759 | 248.601 |
| 2 | 07260039 | 0.421672 | 0.00460100 | 242.621 | 07260042 | 0.0339562 | 0.392317 | 248.213 |
| 3 | 07260047 | 0.412269 | 0.0140040 | 221.320 | 07260046 | 0.0343224 | 0.391951 | 244.939 |
| 4 | 07260044 | 0.417006 | 0.00926700 | 0.00000 | 07260049 | 0.0393921 | 0.386881 | 196.473 |