| Red | Green | Blue | |
| z | 17.64 | ||
| znorm | Inf | ||
| sky | -Inf | -Inf | -Inf |
| S/N | 22.9 | 35.9 | 42.7 |
| S/N(c) | 0.0 | 0.0 | 0.0 |
| SN(E/C) |

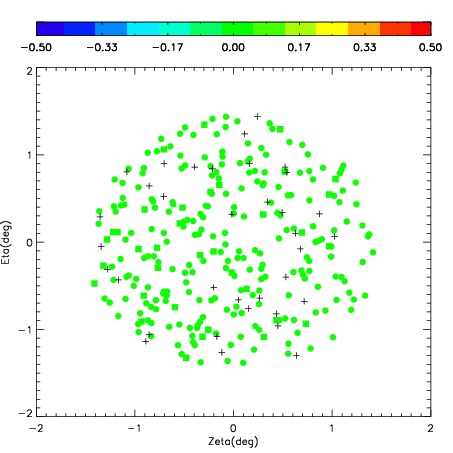
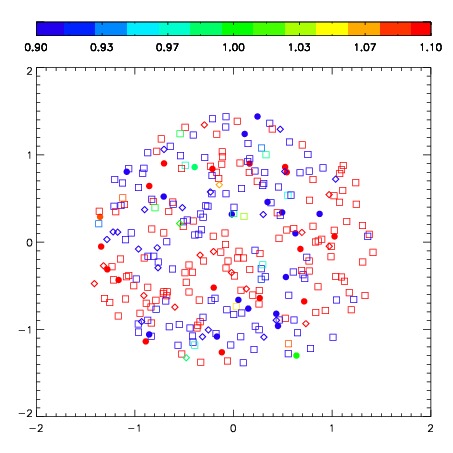
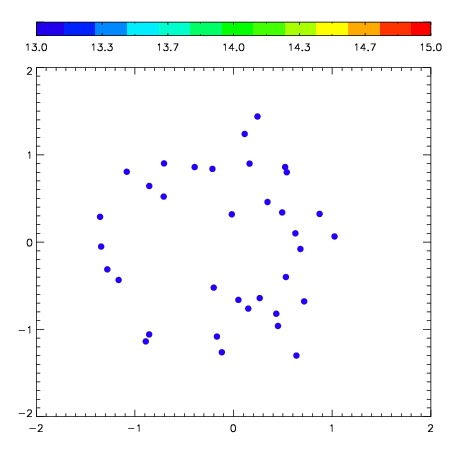
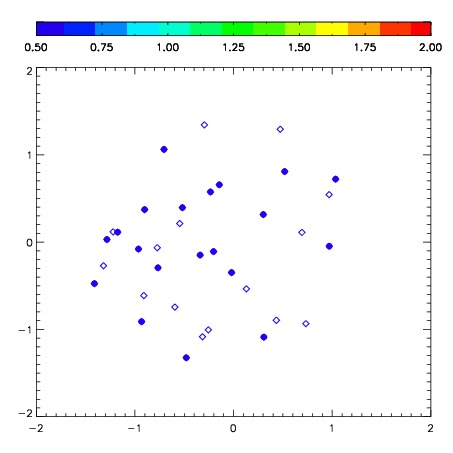
| Frame | Nreads | Zeropoints | Mag plots | Spatial mag deviation | Spatial sky 16325A emission deviations (filled: sky, open: star) | Spatial sky continuum emission | Spatial sky telluric CO2 absorption deviations (filled: H < 10) | |||||||||||||||||||||||
| 0 | 0 |
|
|
|
|
|
|
| IPAIR | NAME | SHIFT | NEWSHIFT | S/N | NAME | SHIFT | NEWSHIFT | S/N |
| 0 | 07000063 | 0.350744 | 0.00000 | 292.528 | 07000061 | 0.00000 | 0.350744 | 290.256 |
| 1 | 07000067 | 0.345947 | 0.00479701 | 288.886 | 07000064 | -0.00253427 | 0.353278 | 286.465 |
| 2 | 07000062 | 0.350573 | 0.000171006 | 284.339 | 07000065 | -0.0121309 | 0.362875 | 274.545 |
| 3 | 07000066 | 0.343995 | 0.00674900 | 284.242 | 07000068 | -0.00424504 | 0.354989 | 270.060 |