| Red | Green | Blue | |
| z | 17.64 | ||
| znorm | Inf | ||
| sky | -Inf | -Inf | -Inf |
| S/N | 20.5 | 35.4 | 39.3 |
| S/N(c) | 0.0 | 0.0 | 0.0 |
| SN(E/C) |
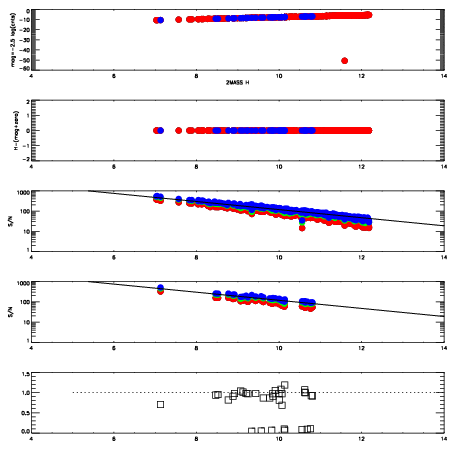
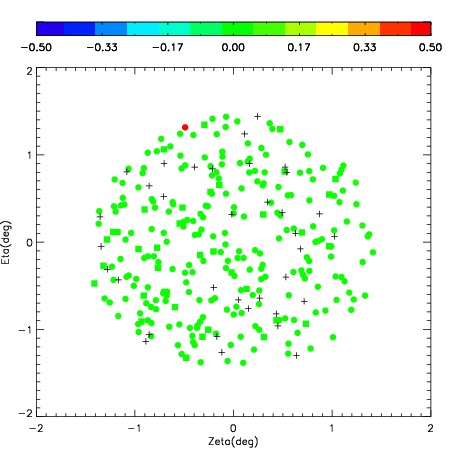
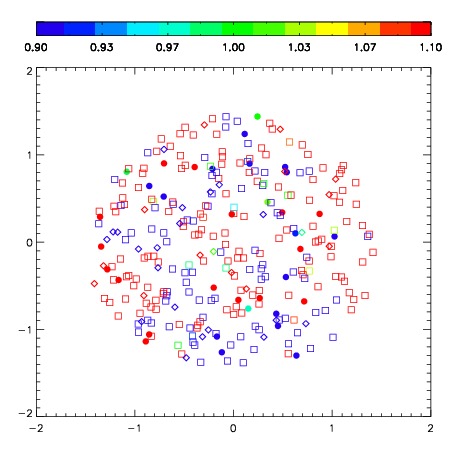
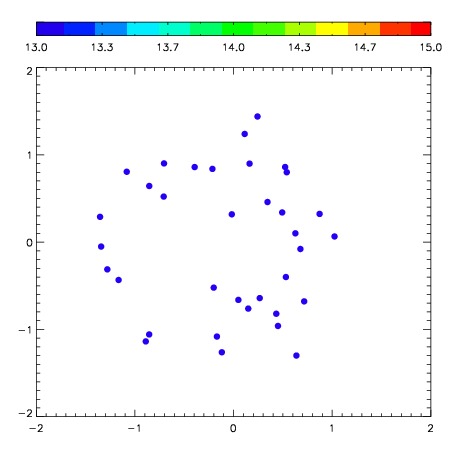
| Frame | Nreads | Zeropoints | Mag plots | Spatial mag deviation | Spatial sky 16325A emission deviations (filled: sky, open: star) | Spatial sky continuum emission | Spatial sky telluric CO2 absorption deviations (filled: H < 10) | |||||||||||||||||||||||
| 0 | 0 |
|
|
|
|
|
|
| IPAIR | NAME | SHIFT | NEWSHIFT | S/N | NAME | SHIFT | NEWSHIFT | S/N |
| 0 | 07510027 | 0.487985 | 0.00000 | 251.709 | 07510029 | 0.0542880 | 0.433697 | 271.354 |
| 1 | 07510026 | 0.482979 | 0.00500599 | 263.617 | 07510025 | 0.00000 | 0.487985 | 272.337 |
| 2 | 07510030 | 0.484168 | 0.00381699 | 238.971 | 07510028 | 0.0622771 | 0.425708 | 262.324 |
| 3 | 07510031 | 0.481573 | 0.00641200 | 224.241 | 07510032 | 0.0514765 | 0.436508 | 251.280 |