| Red | Green | Blue | |
| z | 17.64 | ||
| znorm | Inf | ||
| sky | -NaN | -NaN | -Inf |
| S/N | 24.3 | 42.2 | 47.0 |
| S/N(c) | 0.0 | 0.0 | 0.0 |
| SN(E/C) |
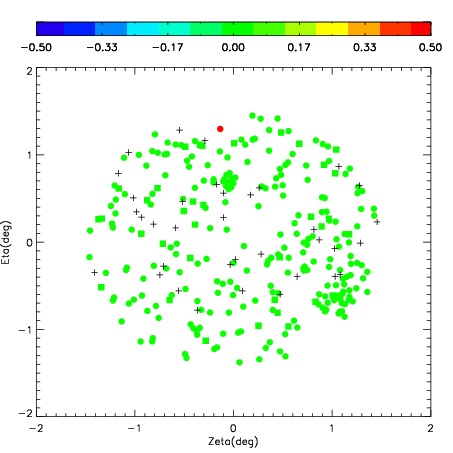
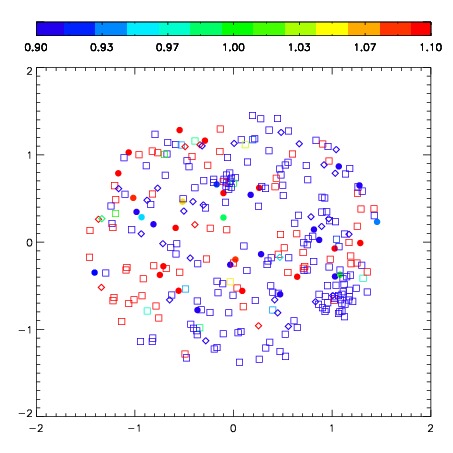
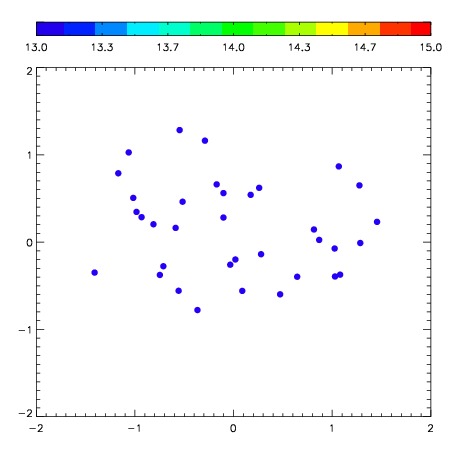
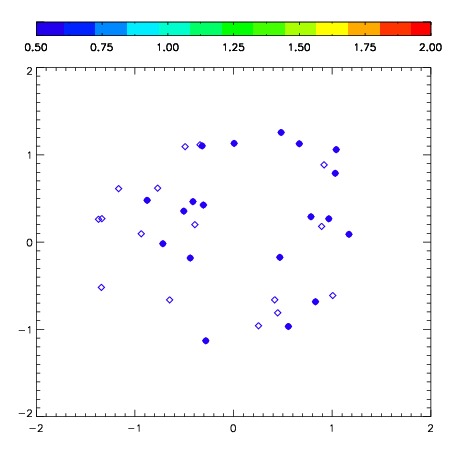
| Frame | Nreads | Zeropoints | Mag plots | Spatial mag deviation | Spatial sky 16325A emission deviations (filled: sky, open: star) | Spatial sky continuum emission | Spatial sky telluric CO2 absorption deviations (filled: H < 10) | |||||||||||||||||||||||
| 0 | 0 |
|
|
|
|
|
|
| IPAIR | NAME | SHIFT | NEWSHIFT | S/N | NAME | SHIFT | NEWSHIFT | S/N |
| 0 | 07280043 | 0.407953 | 0.00000 | 263.444 | 07280044 | 0.0666023 | 0.341351 | 255.560 |
| 1 | 07280038 | 0.394793 | 0.0131600 | 266.677 | 07280040 | 0.0578232 | 0.350130 | 266.875 |
| 2 | 07280039 | 0.397749 | 0.0102040 | 265.455 | 07280041 | 0.0589513 | 0.349002 | 266.115 |
| 3 | 07280042 | 0.393476 | 0.0144770 | 265.269 | 07280037 | 0.00000 | 0.407953 | 260.711 |