| Red | Green | Blue | |
| z | 17.64 | ||
| znorm | Inf | ||
| sky | -Inf | -Inf | -Inf |
| S/N | 29.8 | 48.7 | 52.8 |
| S/N(c) | 0.0 | 0.0 | 0.0 |
| SN(E/C) |

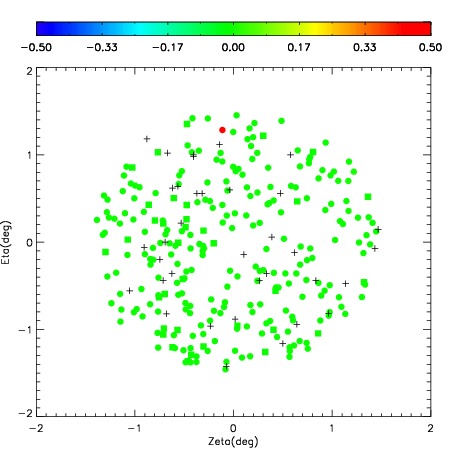
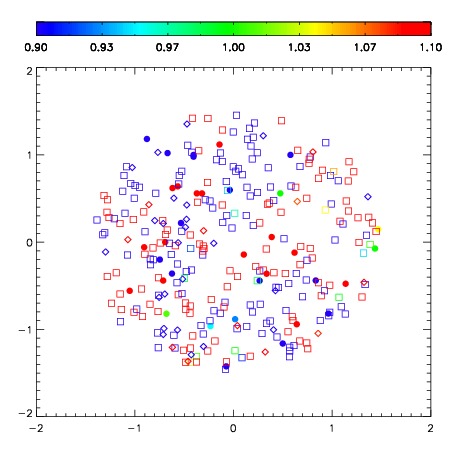
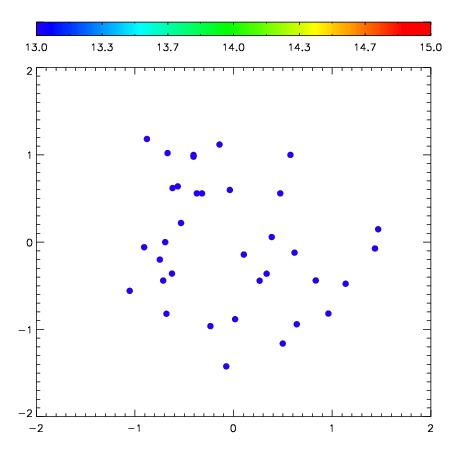

| Frame | Nreads | Zeropoints | Mag plots | Spatial mag deviation | Spatial sky 16325A emission deviations (filled: sky, open: star) | Spatial sky continuum emission | Spatial sky telluric CO2 absorption deviations (filled: H < 10) | |||||||||||||||||||||||
| 0 | 0 |
|
|
|
|
|
|
| IPAIR | NAME | SHIFT | NEWSHIFT | S/N | NAME | SHIFT | NEWSHIFT | S/N |
| 0 | 10290031 | 0.458890 | 0.00000 | 276.998 | 10290034 | 0.0440017 | 0.414888 | 280.987 |
| 1 | 10290032 | 0.454210 | 0.00467998 | 280.408 | 10290033 | 0.0458053 | 0.413085 | 286.274 |
| 2 | 10290036 | 0.452672 | 0.00621799 | 275.459 | 10290037 | 0.0405508 | 0.418339 | 277.535 |
| 3 | 10290035 | 0.454237 | 0.00465298 | 274.014 | 10290030 | 0.00000 | 0.458890 | 265.805 |