| Red | Green | Blue | |
| z | 17.64 | ||
| znorm | Inf | ||
| sky | -Inf | -Inf | -Inf |
| S/N | 27.2 | 44.0 | 51.9 |
| S/N(c) | 0.0 | 0.0 | 0.0 |
| SN(E/C) |


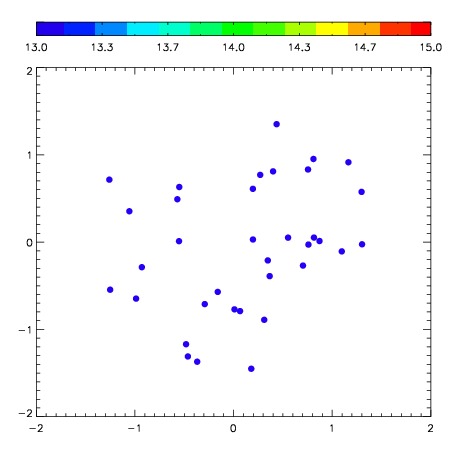
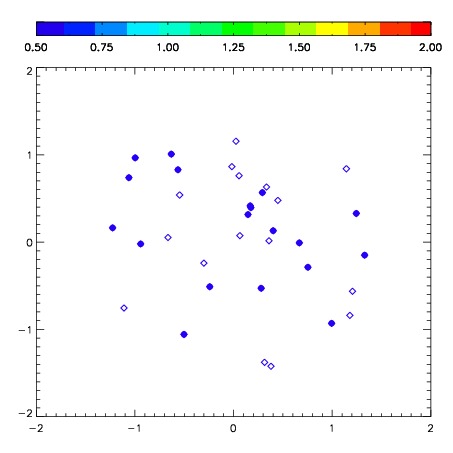
| Frame | Nreads | Zeropoints | Mag plots | Spatial mag deviation | Spatial sky 16325A emission deviations (filled: sky, open: star) | Spatial sky continuum emission | Spatial sky telluric CO2 absorption deviations (filled: H < 10) | |||||||||||||||||||||||
| 0 | 0 |
|
|
|
|
|
|
| IPAIR | NAME | SHIFT | NEWSHIFT | S/N | NAME | SHIFT | NEWSHIFT | S/N |
| 0 | 06940067 | 0.484047 | 0.00000 | 252.728 | 06940064 | 0.0700603 | 0.413987 | 246.610 |
| 1 | 06940063 | 0.477527 | 0.00652000 | 255.001 | 06940065 | 0.0715174 | 0.412530 | 249.279 |
| 2 | 06940066 | 0.471508 | 0.0125390 | 249.969 | 06940068 | 0.0677216 | 0.416325 | 242.831 |
| 3 | 06940062 | 0.477272 | 0.00677499 | 246.949 | 06940061 | 0.00000 | 0.484047 | 234.173 |