| Red | Green | Blue | |
| z | 17.63 | ||
| znorm | Inf | ||
| sky | -NaN | -NaN | -Inf |
| S/N | 25.3 | 41.7 | 46.0 |
| S/N(c) | 0.0 | 0.0 | 0.0 |
| SN(E/C) |

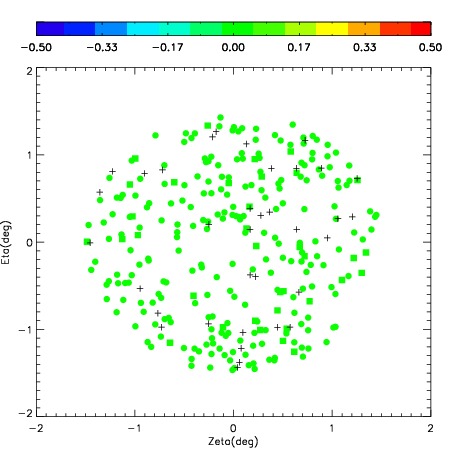
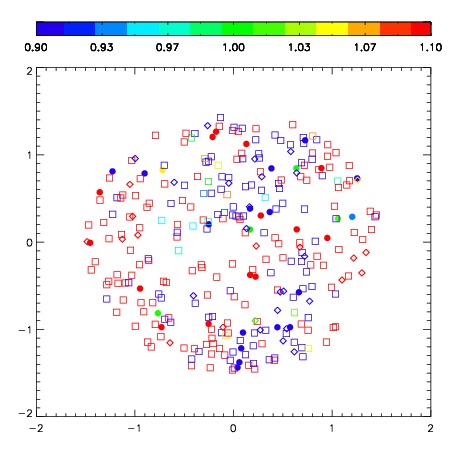
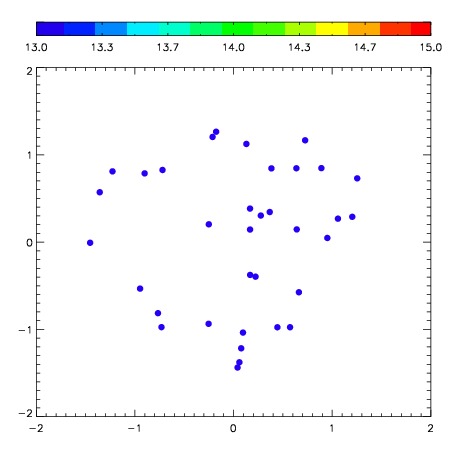
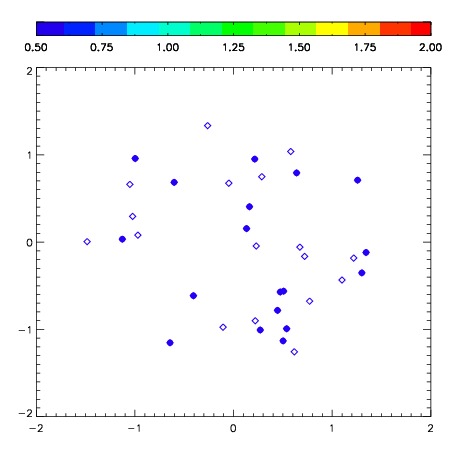
| Frame | Nreads | Zeropoints | Mag plots | Spatial mag deviation | Spatial sky 16325A emission deviations (filled: sky, open: star) | Spatial sky continuum emission | Spatial sky telluric CO2 absorption deviations (filled: H < 10) | |||||||||||||||||||||||
| 0 | 0 |
|
|
|
|
|
|
| IPAIR | NAME | SHIFT | NEWSHIFT | S/N | NAME | SHIFT | NEWSHIFT | S/N |
| 0 | 07900012 | 0.407912 | 0.00000 | 214.912 | 07900014 | -0.00762007 | 0.415532 | 218.787 |
| 1 | 07900017 | 0.394750 | 0.0131620 | 222.809 | 07900011 | 0.00000 | 0.407912 | 221.758 |
| 2 | 07900016 | 0.400606 | 0.00730598 | 220.724 | 07900018 | -0.00174958 | 0.409662 | 220.860 |
| 3 | 07900013 | 0.397621 | 0.0102910 | 218.340 | 07900015 | -0.00254005 | 0.410452 | 219.908 |