| Red | Green | Blue | |
| z | 17.64 | ||
| znorm | Inf | ||
| sky | -NaN | -NaN | -Inf |
| S/N | 22.0 | 40.5 | 43.4 |
| S/N(c) | 0.0 | 0.0 | 0.0 |
| SN(E/C) |
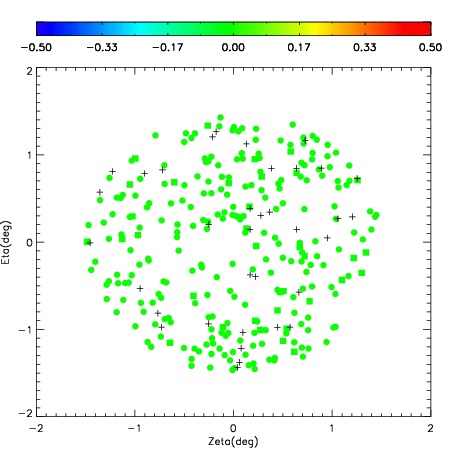
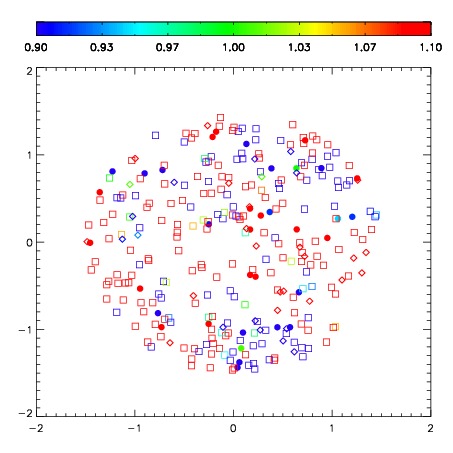
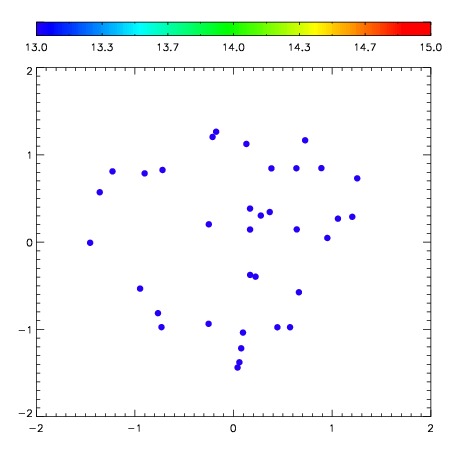

| Frame | Nreads | Zeropoints | Mag plots | Spatial mag deviation | Spatial sky 16325A emission deviations (filled: sky, open: star) | Spatial sky continuum emission | Spatial sky telluric CO2 absorption deviations (filled: H < 10) | |||||||||||||||||||||||
| 0 | 0 |
|
|
|
|
|
|
| IPAIR | NAME | SHIFT | NEWSHIFT | S/N | NAME | SHIFT | NEWSHIFT | S/N |
| 0 | 10610055 | 0.520437 | 0.00000 | 181.674 | 10610054 | 0.0349280 | 0.485509 | 200.015 |
| 1 | 10610059 | 0.507995 | 0.0124420 | 213.386 | 10610058 | 0.0345758 | 0.485861 | 221.139 |
| 2 | 10610060 | 0.518574 | 0.00186300 | 212.627 | 10610050 | 0.00000 | 0.520437 | 218.959 |
| 3 | 10610051 | 0.509808 | 0.0106290 | 211.314 | 10610057 | 0.0331691 | 0.487268 | 214.627 |
| 4 | 10610052 | 0.508758 | 0.0116790 | 209.197 | 10610061 | 0.0341322 | 0.486305 | 213.696 |
| 5 | 10610056 | 0.516593 | 0.00384402 | 188.321 | 10610053 | 0.0349997 | 0.485437 | 212.860 |