| Red | Green | Blue | |
| z | 17.64 | ||
| znorm | Inf | ||
| sky | -NaN | -Inf | -Inf |
| S/N | 16.1 | 30.2 | 30.9 |
| S/N(c) | 0.0 | 0.0 | 0.0 |
| SN(E/C) |

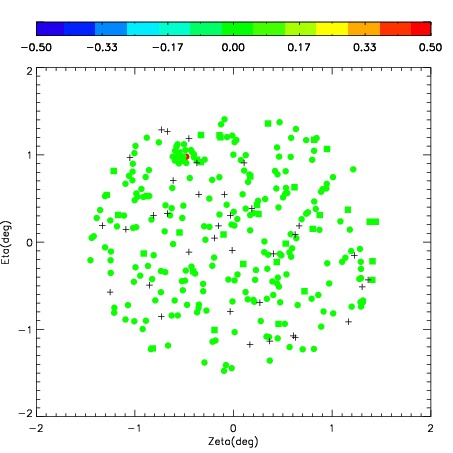
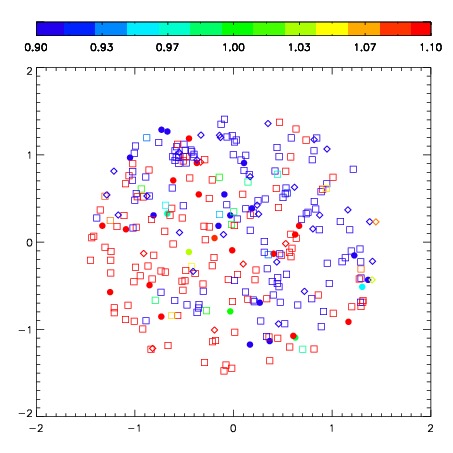
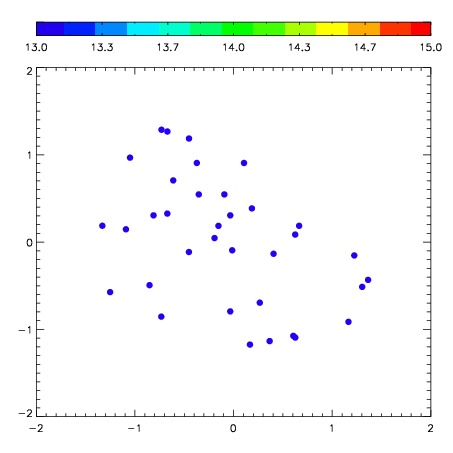
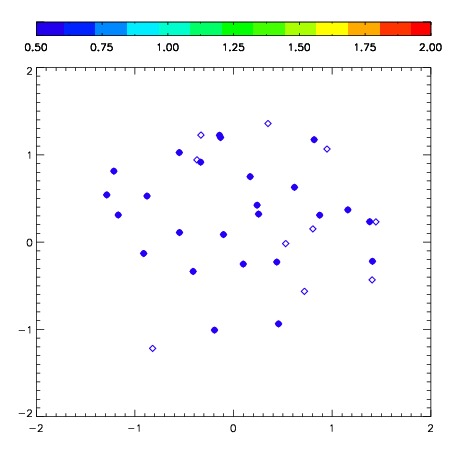
| Frame | Nreads | Zeropoints | Mag plots | Spatial mag deviation | Spatial sky 16325A emission deviations (filled: sky, open: star) | Spatial sky continuum emission | Spatial sky telluric CO2 absorption deviations (filled: H < 10) | |||||||||||||||||||||||
| 0 | 0 |
|
|
|
|
|
|
| IPAIR | NAME | SHIFT | NEWSHIFT | S/N | NAME | SHIFT | NEWSHIFT | S/N |
| 0 | 07050013 | 0.402732 | 0.00000 | 180.679 | 07050014 | 0.0167751 | 0.385957 | 170.968 |
| 1 | 07050012 | 0.398780 | 0.00395203 | 191.098 | 07050011 | 0.00000 | 0.402732 | 189.026 |
| 2 | 07050016 | 0.395000 | 0.00773200 | 170.549 | 07050018 | 0.0164006 | 0.386331 | 163.301 |
| 3 | 07050017 | 0.397344 | 0.00538802 | 162.849 | 07050015 | 0.0200825 | 0.382650 | 160.986 |