| Red | Green | Blue | |
| z | 17.64 | ||
| znorm | Inf | ||
| sky | -Inf | -Inf | -Inf |
| S/N | 34.3 | 55.9 | 65.3 |
| S/N(c) | 0.0 | 0.0 | 0.0 |
| SN(E/C) |


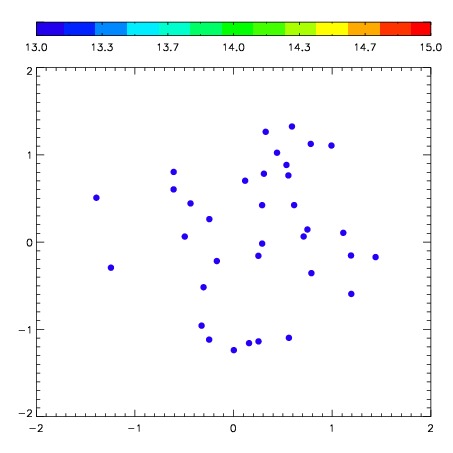
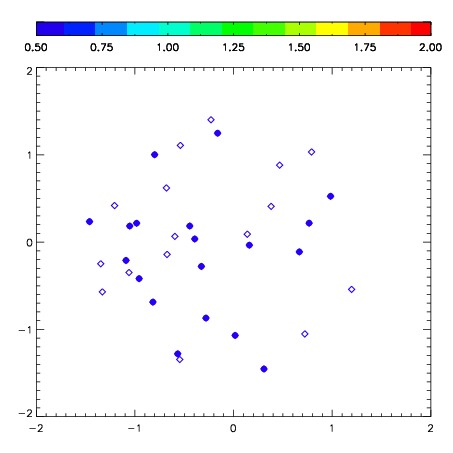
| Frame | Nreads | Zeropoints | Mag plots | Spatial mag deviation | Spatial sky 16325A emission deviations (filled: sky, open: star) | Spatial sky continuum emission | Spatial sky telluric CO2 absorption deviations (filled: H < 10) | |||||||||||||||||||||||
| 0 | 0 |
|
|
|
|
|
|
| IPAIR | NAME | SHIFT | NEWSHIFT | S/N | NAME | SHIFT | NEWSHIFT | S/N |
| 0 | 06980075 | 0.500813 | 0.00000 | 274.617 | 06980074 | 0.0443334 | 0.456480 | 273.831 |
| 1 | 06980076 | 0.497964 | 0.00284901 | 277.676 | 06980077 | 0.0438277 | 0.456985 | 275.433 |
| 2 | 06980072 | 0.497446 | 0.00336701 | 275.525 | 06980078 | 0.0456739 | 0.455139 | 274.773 |
| 3 | 06980071 | 0.496231 | 0.00458202 | 273.575 | 06980073 | 0.0428471 | 0.457966 | 273.819 |
| 4 | 06980079 | 0.495035 | 0.00577801 | 270.987 | 06980070 | 0.00000 | 0.500813 | 270.429 |