| Red | Green | Blue | |
| z | 17.64 | ||
| znorm | Inf | ||
| sky | -NaN | -Inf | -Inf |
| S/N | 30.0 | 53.2 | 61.3 |
| S/N(c) | 0.0 | 0.0 | 0.0 |
| SN(E/C) |

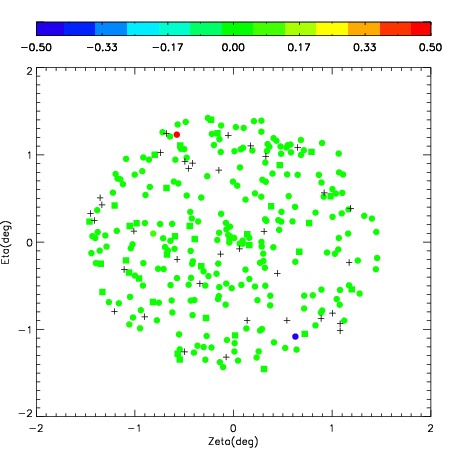
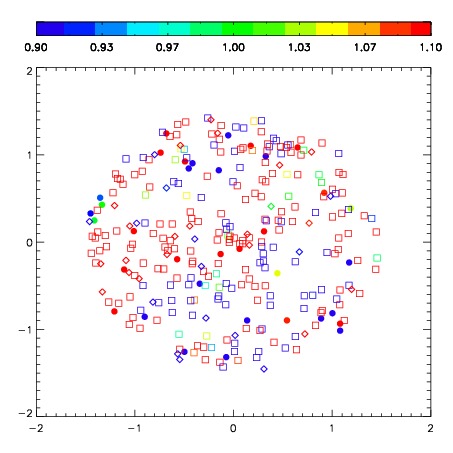


| Frame | Nreads | Zeropoints | Mag plots | Spatial mag deviation | Spatial sky 16325A emission deviations (filled: sky, open: star) | Spatial sky continuum emission | Spatial sky telluric CO2 absorption deviations (filled: H < 10) | |||||||||||||||||||||||
| 0 | 0 |
|
|
|
|
|
|
| IPAIR | NAME | SHIFT | NEWSHIFT | S/N | NAME | SHIFT | NEWSHIFT | S/N |
| 0 | 06940073 | 0.529603 | 0.00000 | 265.087 | 06940079 | 0.0560351 | 0.473568 | 263.963 |
| 1 | 06940074 | 0.527000 | 0.00260299 | 271.941 | 06940076 | 0.0562901 | 0.473313 | 274.761 |
| 2 | 06940078 | 0.523090 | 0.00651300 | 270.625 | 06940083 | 0.0533302 | 0.476273 | 269.439 |
| 3 | 06940082 | 0.521201 | 0.00840199 | 269.905 | 06940072 | 0.00000 | 0.529603 | 269.324 |
| 4 | 06940081 | 0.522371 | 0.00723201 | 265.320 | 06940075 | 0.0506096 | 0.478993 | 264.810 |
| 5 | 06940077 | 0.525427 | 0.00417602 | 263.252 | 06940080 | 0.0539992 | 0.475604 | 257.083 |