| Red | Green | Blue | |
| z | 17.64 | ||
| znorm | Inf | ||
| sky | -Inf | -Inf | -Inf |
| S/N | 32.3 | 53.6 | 61.3 |
| S/N(c) | 0.0 | 0.0 | 0.0 |
| SN(E/C) |

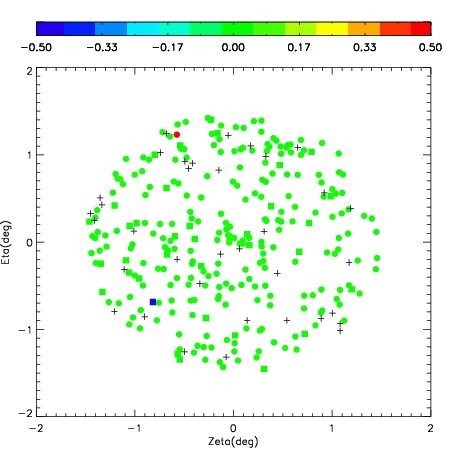
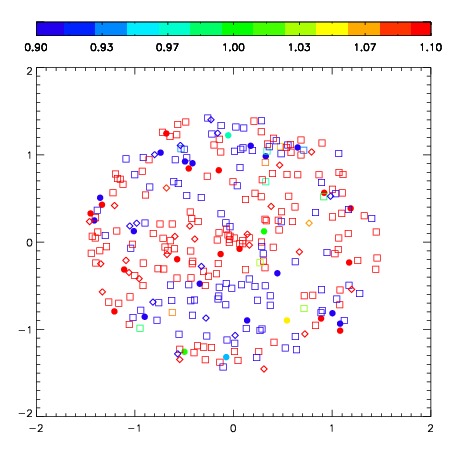


| Frame | Nreads | Zeropoints | Mag plots | Spatial mag deviation | Spatial sky 16325A emission deviations (filled: sky, open: star) | Spatial sky continuum emission | Spatial sky telluric CO2 absorption deviations (filled: H < 10) | |||||||||||||||||||||||
| 0 | 0 |
|
|
|
|
|
|
| IPAIR | NAME | SHIFT | NEWSHIFT | S/N | NAME | SHIFT | NEWSHIFT | S/N |
| 0 | 06990066 | 0.467870 | 0.00000 | 275.026 | 06990068 | 0.0239645 | 0.443906 | 278.015 |
| 1 | 06990069 | 0.463731 | 0.00413901 | 275.817 | 06990071 | 0.0214929 | 0.446377 | 279.284 |
| 2 | 06990065 | 0.464904 | 0.00296599 | 274.337 | 06990067 | 0.0245411 | 0.443329 | 274.253 |
| 3 | 06990070 | 0.460110 | 0.00775999 | 272.600 | 06990072 | 0.0216625 | 0.446207 | 272.403 |
| 4 | 06990073 | 0.464433 | 0.00343698 | 266.204 | 06990064 | 0.00000 | 0.467870 | 268.546 |