| Red | Green | Blue | |
| z | 17.64 | ||
| znorm | Inf | ||
| sky | -NaN | -Inf | -Inf |
| S/N | 13.6 | 24.9 | 26.4 |
| S/N(c) | 0.0 | 0.0 | 0.0 |
| SN(E/C) |


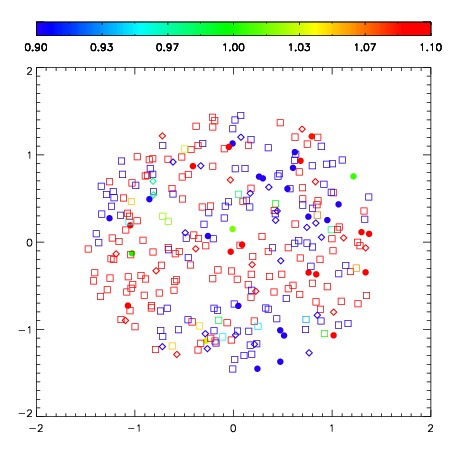

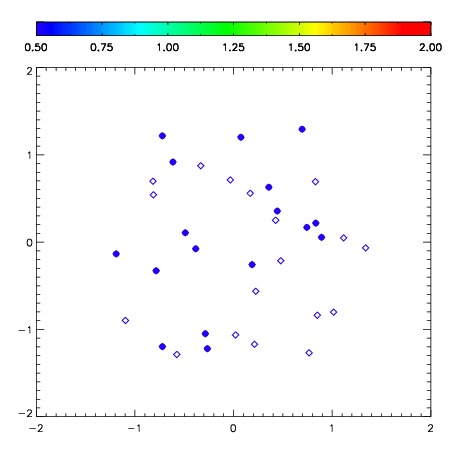
| Frame | Nreads | Zeropoints | Mag plots | Spatial mag deviation | Spatial sky 16325A emission deviations (filled: sky, open: star) | Spatial sky continuum emission | Spatial sky telluric CO2 absorption deviations (filled: H < 10) | |||||||||||||||||||||||
| 0 | 0 |
|
|
|
|
|
|
| IPAIR | NAME | SHIFT | NEWSHIFT | S/N | NAME | SHIFT | NEWSHIFT | S/N |
| 0 | 10510014 | 0.505123 | 0.00000 | 157.009 | 10510012 | 0.00000 | 0.505123 | 157.631 |
| 1 | 10510013 | 0.503193 | 0.00193000 | 160.261 | 10510015 | 0.0567801 | 0.448343 | 159.733 |