| Red | Green | Blue | |
| z | 17.64 | ||
| znorm | Inf | ||
| sky | -Inf | -Inf | -Inf |
| S/N | 25.3 | 42.1 | 47.4 |
| S/N(c) | 0.0 | 0.0 | 0.0 |
| SN(E/C) |

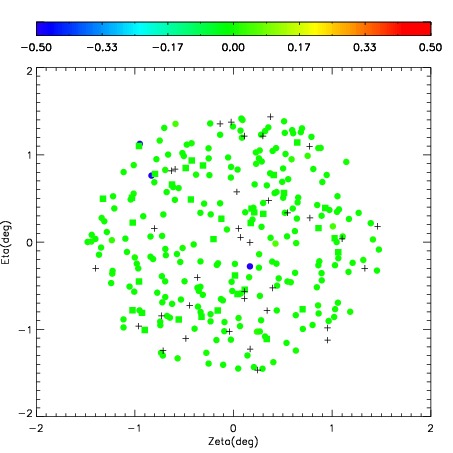
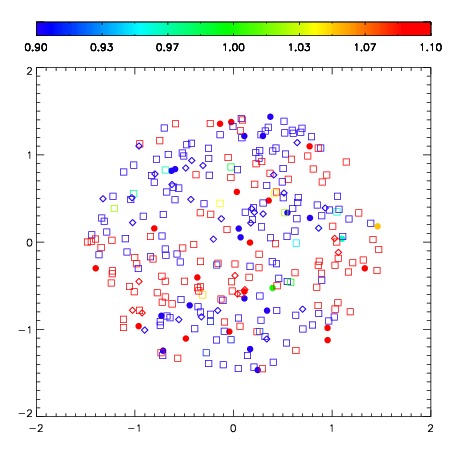
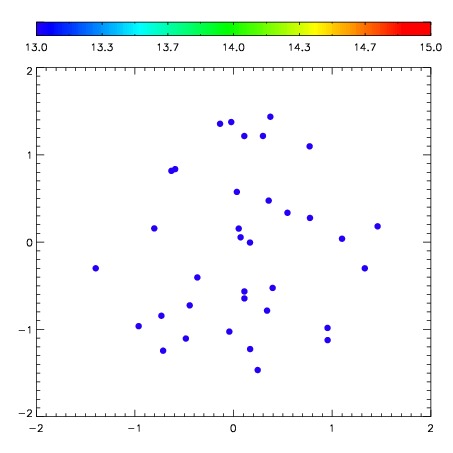
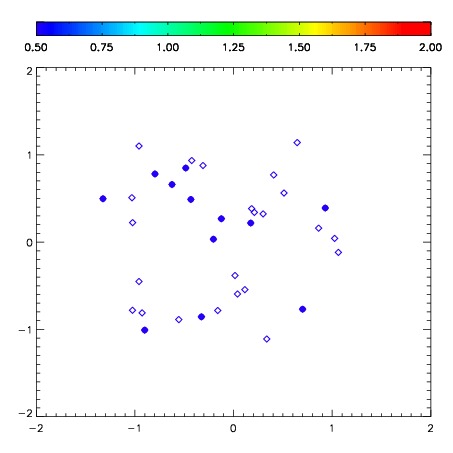
| Frame | Nreads | Zeropoints | Mag plots | Spatial mag deviation | Spatial sky 16325A emission deviations (filled: sky, open: star) | Spatial sky continuum emission | Spatial sky telluric CO2 absorption deviations (filled: H < 10) | |||||||||||||||||||||||
| 0 | 0 |
|
|
|
|
|
|
| IPAIR | NAME | SHIFT | NEWSHIFT | S/N | NAME | SHIFT | NEWSHIFT | S/N |
| 0 | 10540043 | 0.488979 | 0.00000 | 228.052 | 10540040 | 0.0329195 | 0.456060 | 227.926 |
| 1 | 10540042 | 0.486087 | 0.00289202 | 235.169 | 10540041 | 0.0342405 | 0.454738 | 242.475 |
| 2 | 10540039 | 0.477998 | 0.0109810 | 221.185 | 10540037 | 0.00000 | 0.488979 | 211.914 |
| 3 | 10540038 | 0.483755 | 0.00522402 | 219.492 | 10540044 | 0.0355809 | 0.453398 | 211.516 |