| Red | Green | Blue | |
| z | 17.64 | ||
| znorm | Inf | ||
| sky | -NaN | -NaN | -Inf |
| S/N | 26.2 | 42.0 | 48.2 |
| S/N(c) | 0.0 | 0.0 | 0.0 |
| SN(E/C) |
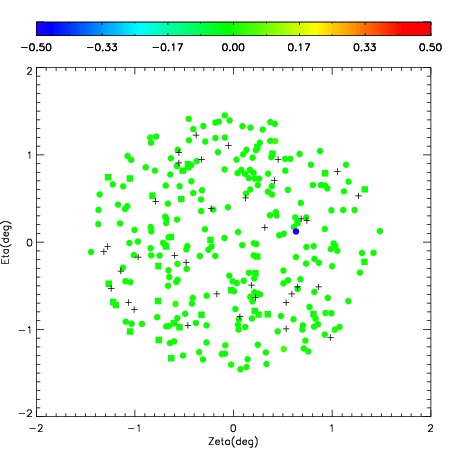
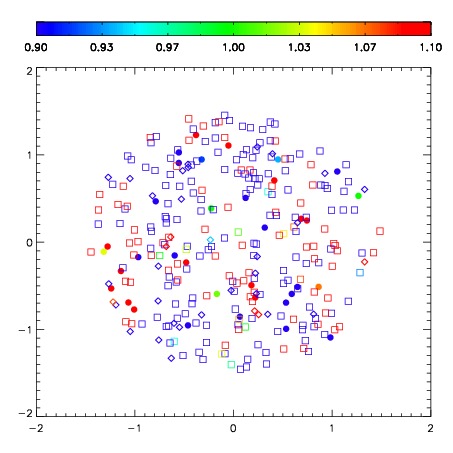
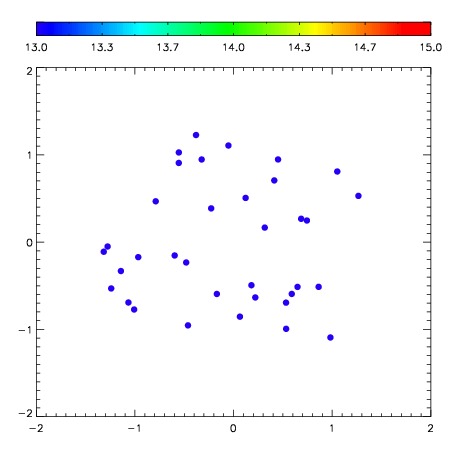

| Frame | Nreads | Zeropoints | Mag plots | Spatial mag deviation | Spatial sky 16325A emission deviations (filled: sky, open: star) | Spatial sky continuum emission | Spatial sky telluric CO2 absorption deviations (filled: H < 10) | |||||||||||||||||||||||
| 0 | 0 |
|
|
|
|
|
|
| IPAIR | NAME | SHIFT | NEWSHIFT | S/N | NAME | SHIFT | NEWSHIFT | S/N |
| 0 | 10200050 | 0.462373 | 0.00000 | 276.552 | 10200055 | 0.0432476 | 0.419125 | 288.542 |
| 1 | 10200054 | 0.455733 | 0.00663999 | 273.583 | 10200051 | 0.0491451 | 0.413228 | 279.361 |
| 2 | 10200049 | 0.460781 | 0.00159198 | 269.583 | 10200052 | 0.0490178 | 0.413355 | 278.789 |
| 3 | 10200053 | 0.461182 | 0.00119099 | 267.865 | 10200048 | 0.00000 | 0.462373 | 260.474 |